Back chapter figures
FAQ 3.1, Figure 1
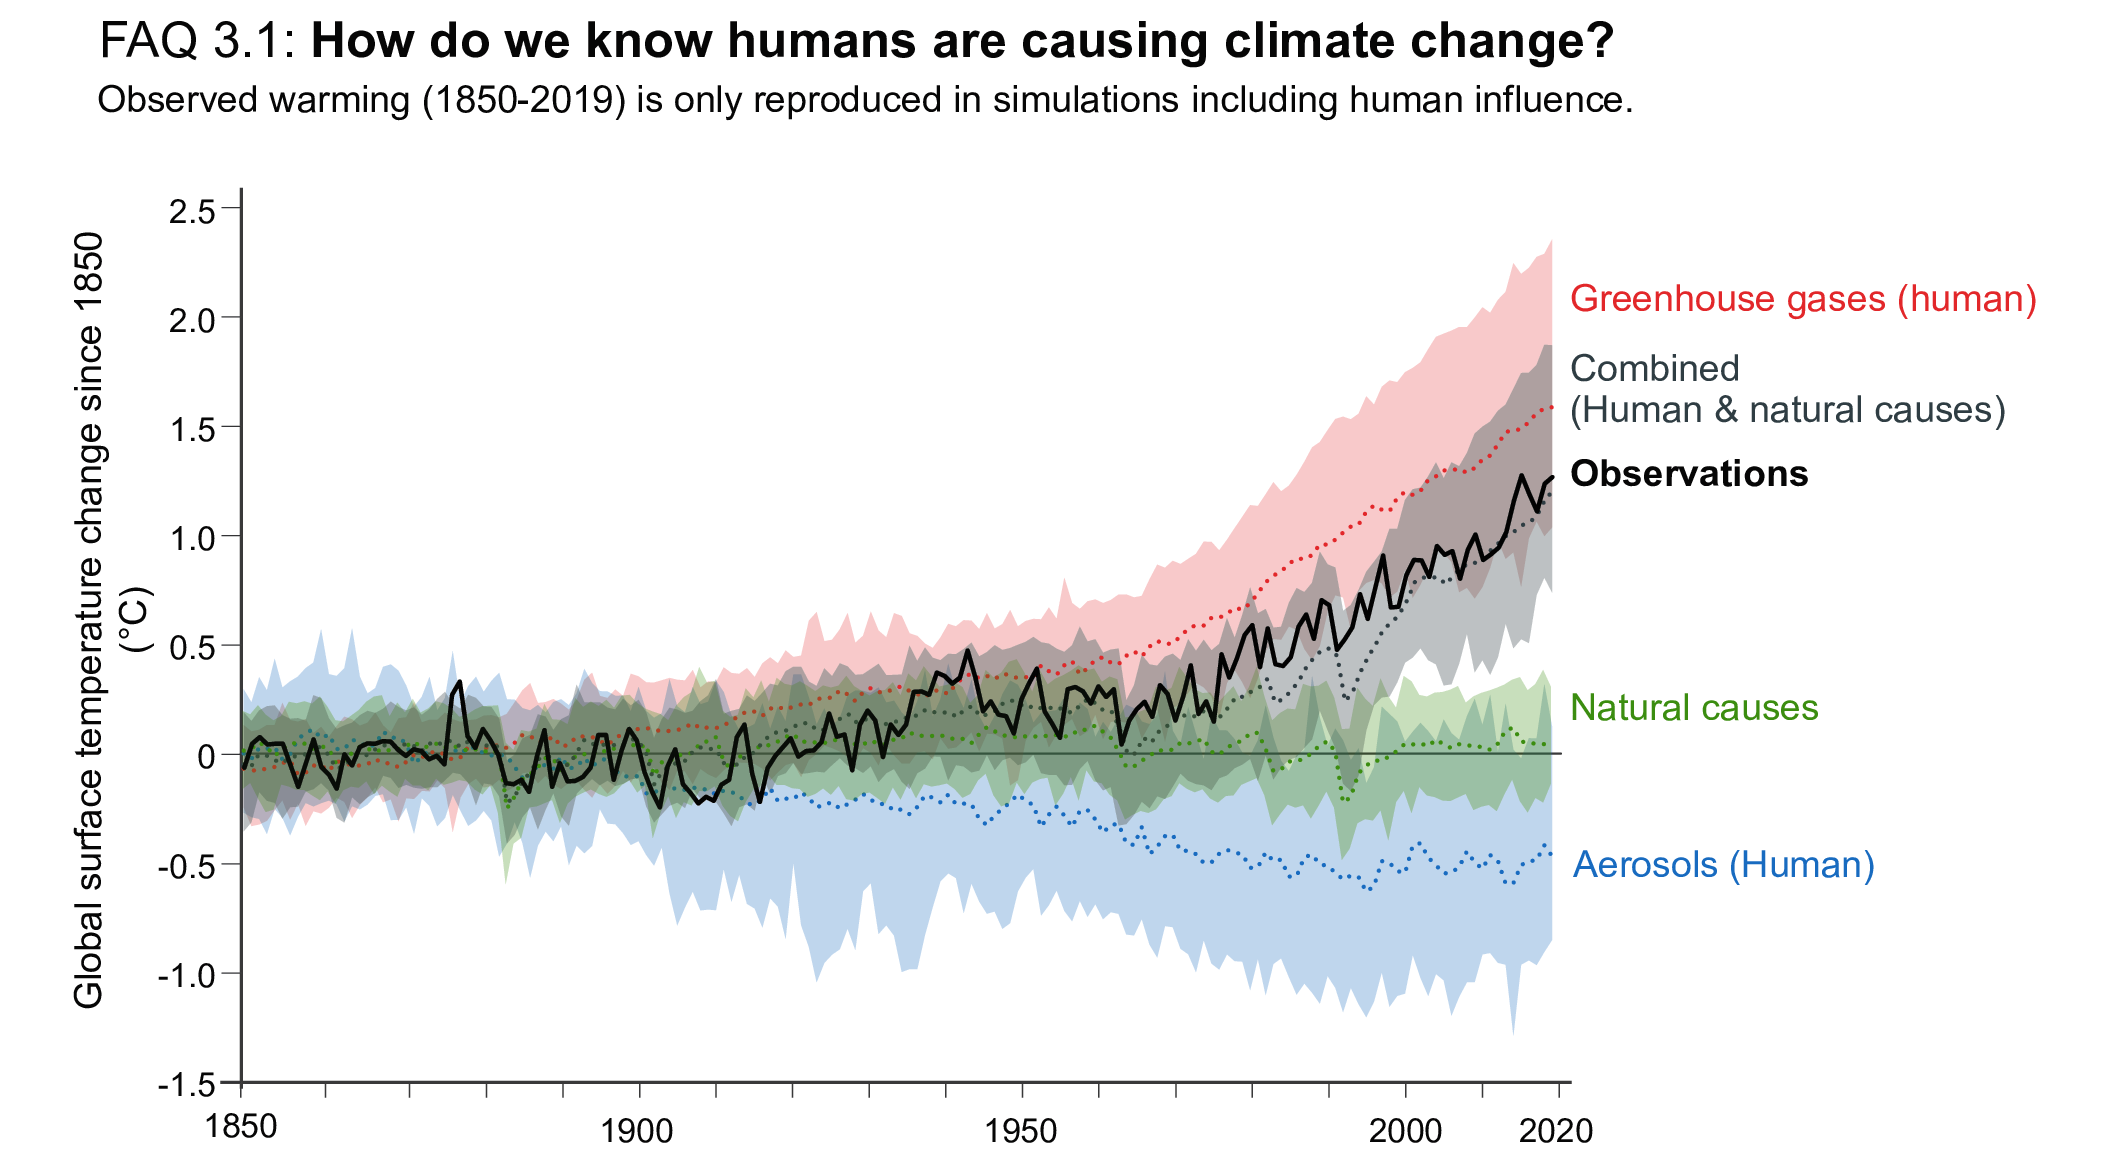
Figure caption
FAQ 3.1, Figure 1 | Observed warming (1850–2019) is only reproduced in simulations including human influence. Global surface temperature changes in observations, compared to climate model simulations of the response to all human and natural forcings (grey band), greenhouse gases only (red band), aerosols and other human drivers only (blue band) and natural forcings only (green band). Solid coloured lines show the multi-model mean, and coloured bands show the 5–95% range of individual simulations.