FAQ 3.3, Figure 1
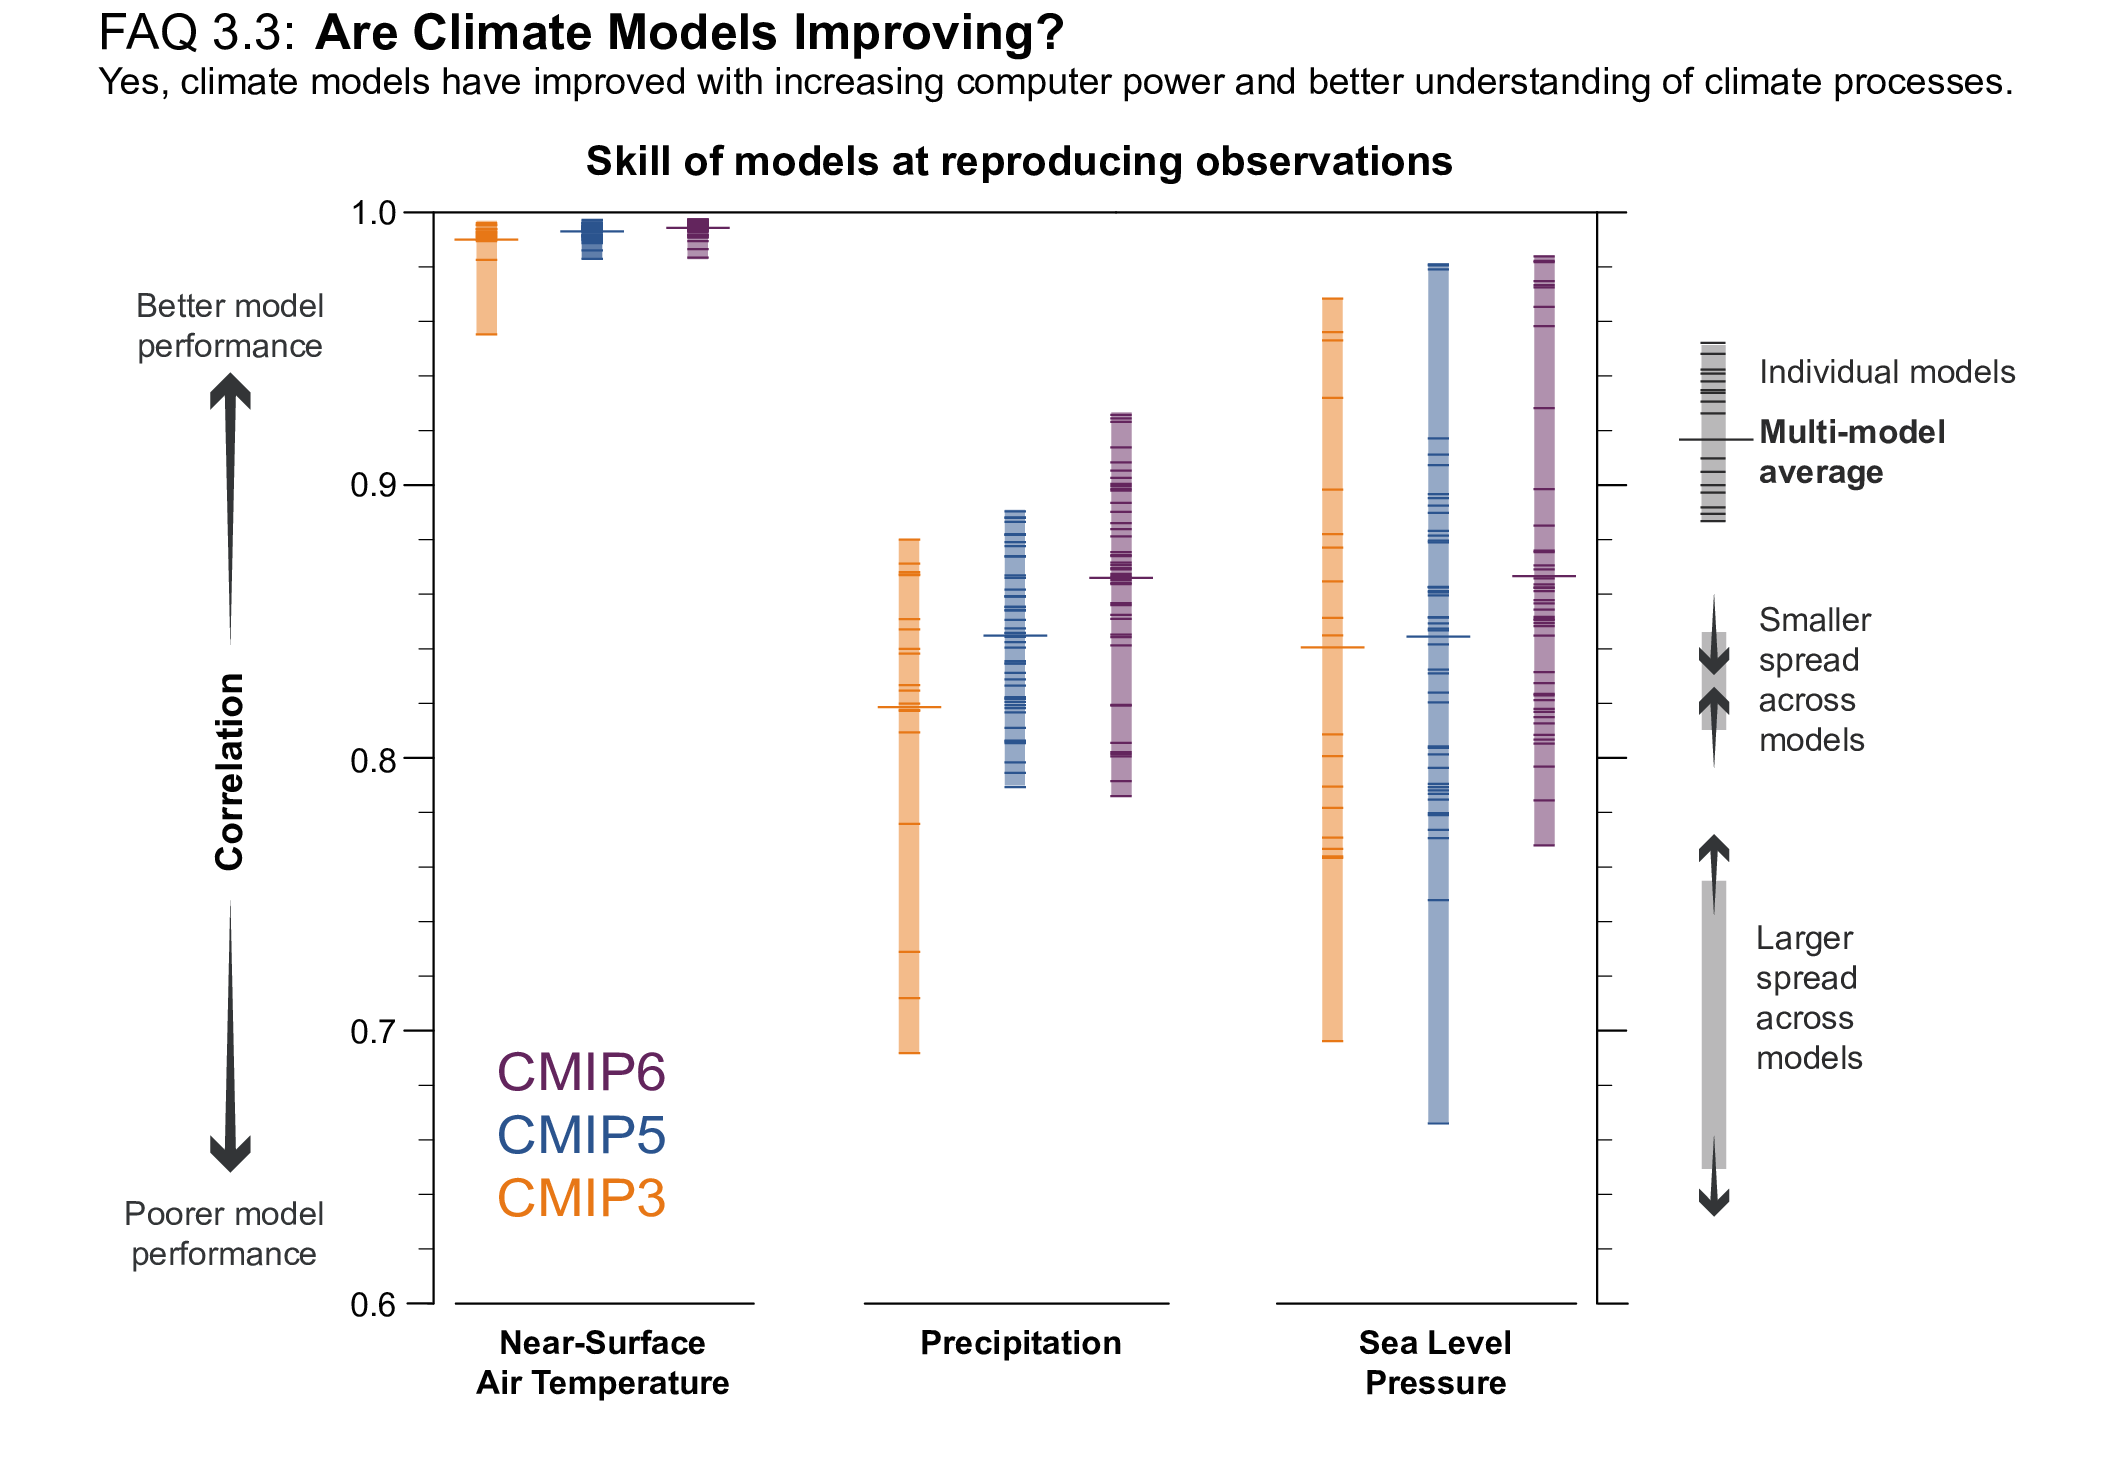
Figure caption
FAQ 3.3, Figure 1 | Pattern correlations between models and observations of three different variables: surface air temperature, precipitation and sea level pressure. Results are shown for the three most recent generations of models, from the Coupled Model Intercomparison Project (CMIP): CMIP3 (orange), CMIP5 (blue) and CMIP6 (purple). Individual model results are shown as short lines, along with the corresponding ensemble average (long line). For the correlations the yearly averages of the models are compared with the reference observations for the period 1980–1999, with 1 representing perfect similarity between the models and observations. CMIP3 simulations performed in 2004-2008 were assessed in the IPCC Fourth Assessment, CMIP5 simulations performed in 2011–2013 were assessed in the IPCC Fifth Assessment, and CMIP6 simulations performed in 2018–2021 are assessed in this Report.