Back chapter figures
Figure 3.10
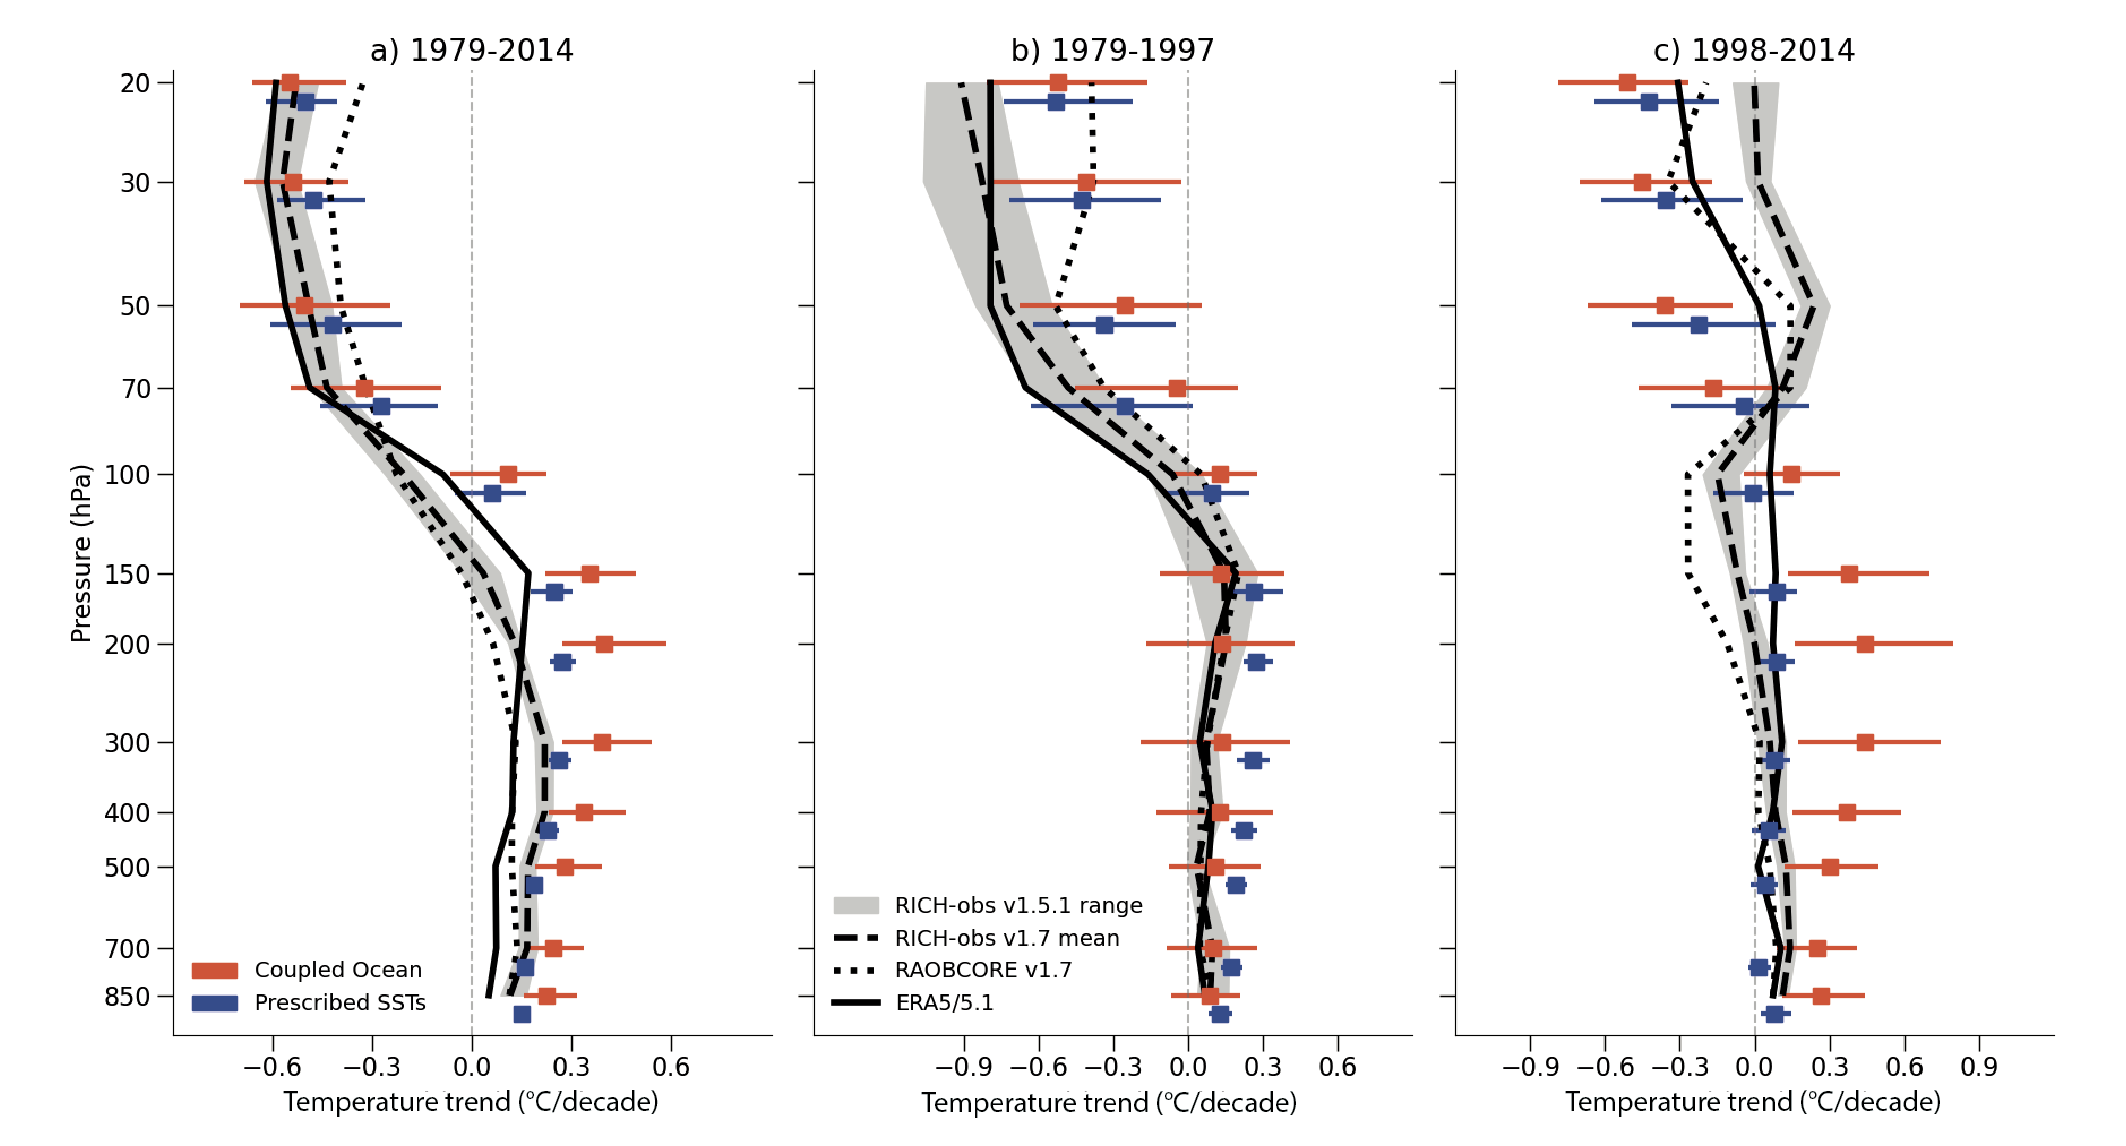
Figure caption
Figure 3.10 | Observed and simulated tropical mean temperature trends through the atmosphere. Vertical profiles of temperature trends in the tropics (20°S–20°N) for three periods: (a) 1979–2014, (b) 1979–1997 (ozone depletion era) and (c) 1998–2014 (ozone stabilization era). The black lines show trends in the Radiosonde Innovation Composite Homogenization (RICH) 1.7 (long dashed) and Radiosonde Observation Correction using Reanalysis (RAOBCORE) 1.7 (dashed) radiosonde datasets (Haimberger et al., 2012), and in the ERA5/5.1 reanalysis (solid). Grey envelopes are centred on the RICH 1.7 trends, but show the uncertainty based on 32 RICH-observations members of version 1.5.1 of the dataset, which used version 1.7.3 of the RICH software but with the parameters of version 1.5.1. ERA5 was used as reference for calculating the adjustments between 2010 and 2019, and ERA-Interim was used for the years before that. Red lines show trends in CMIP6 historical simulations from one realization of each of 60 models. Blue lines show trends in 46 CMIP6 models that used prescribed, rather than simulated, sea surface temperatures (SSTs). Figure is adapted from Mitchell et al. (2020), their Figure 1. Further details on data sources and processing are available in the chapter data table (Table 3.SM.1).