Back chapter figures
Figure 3.11
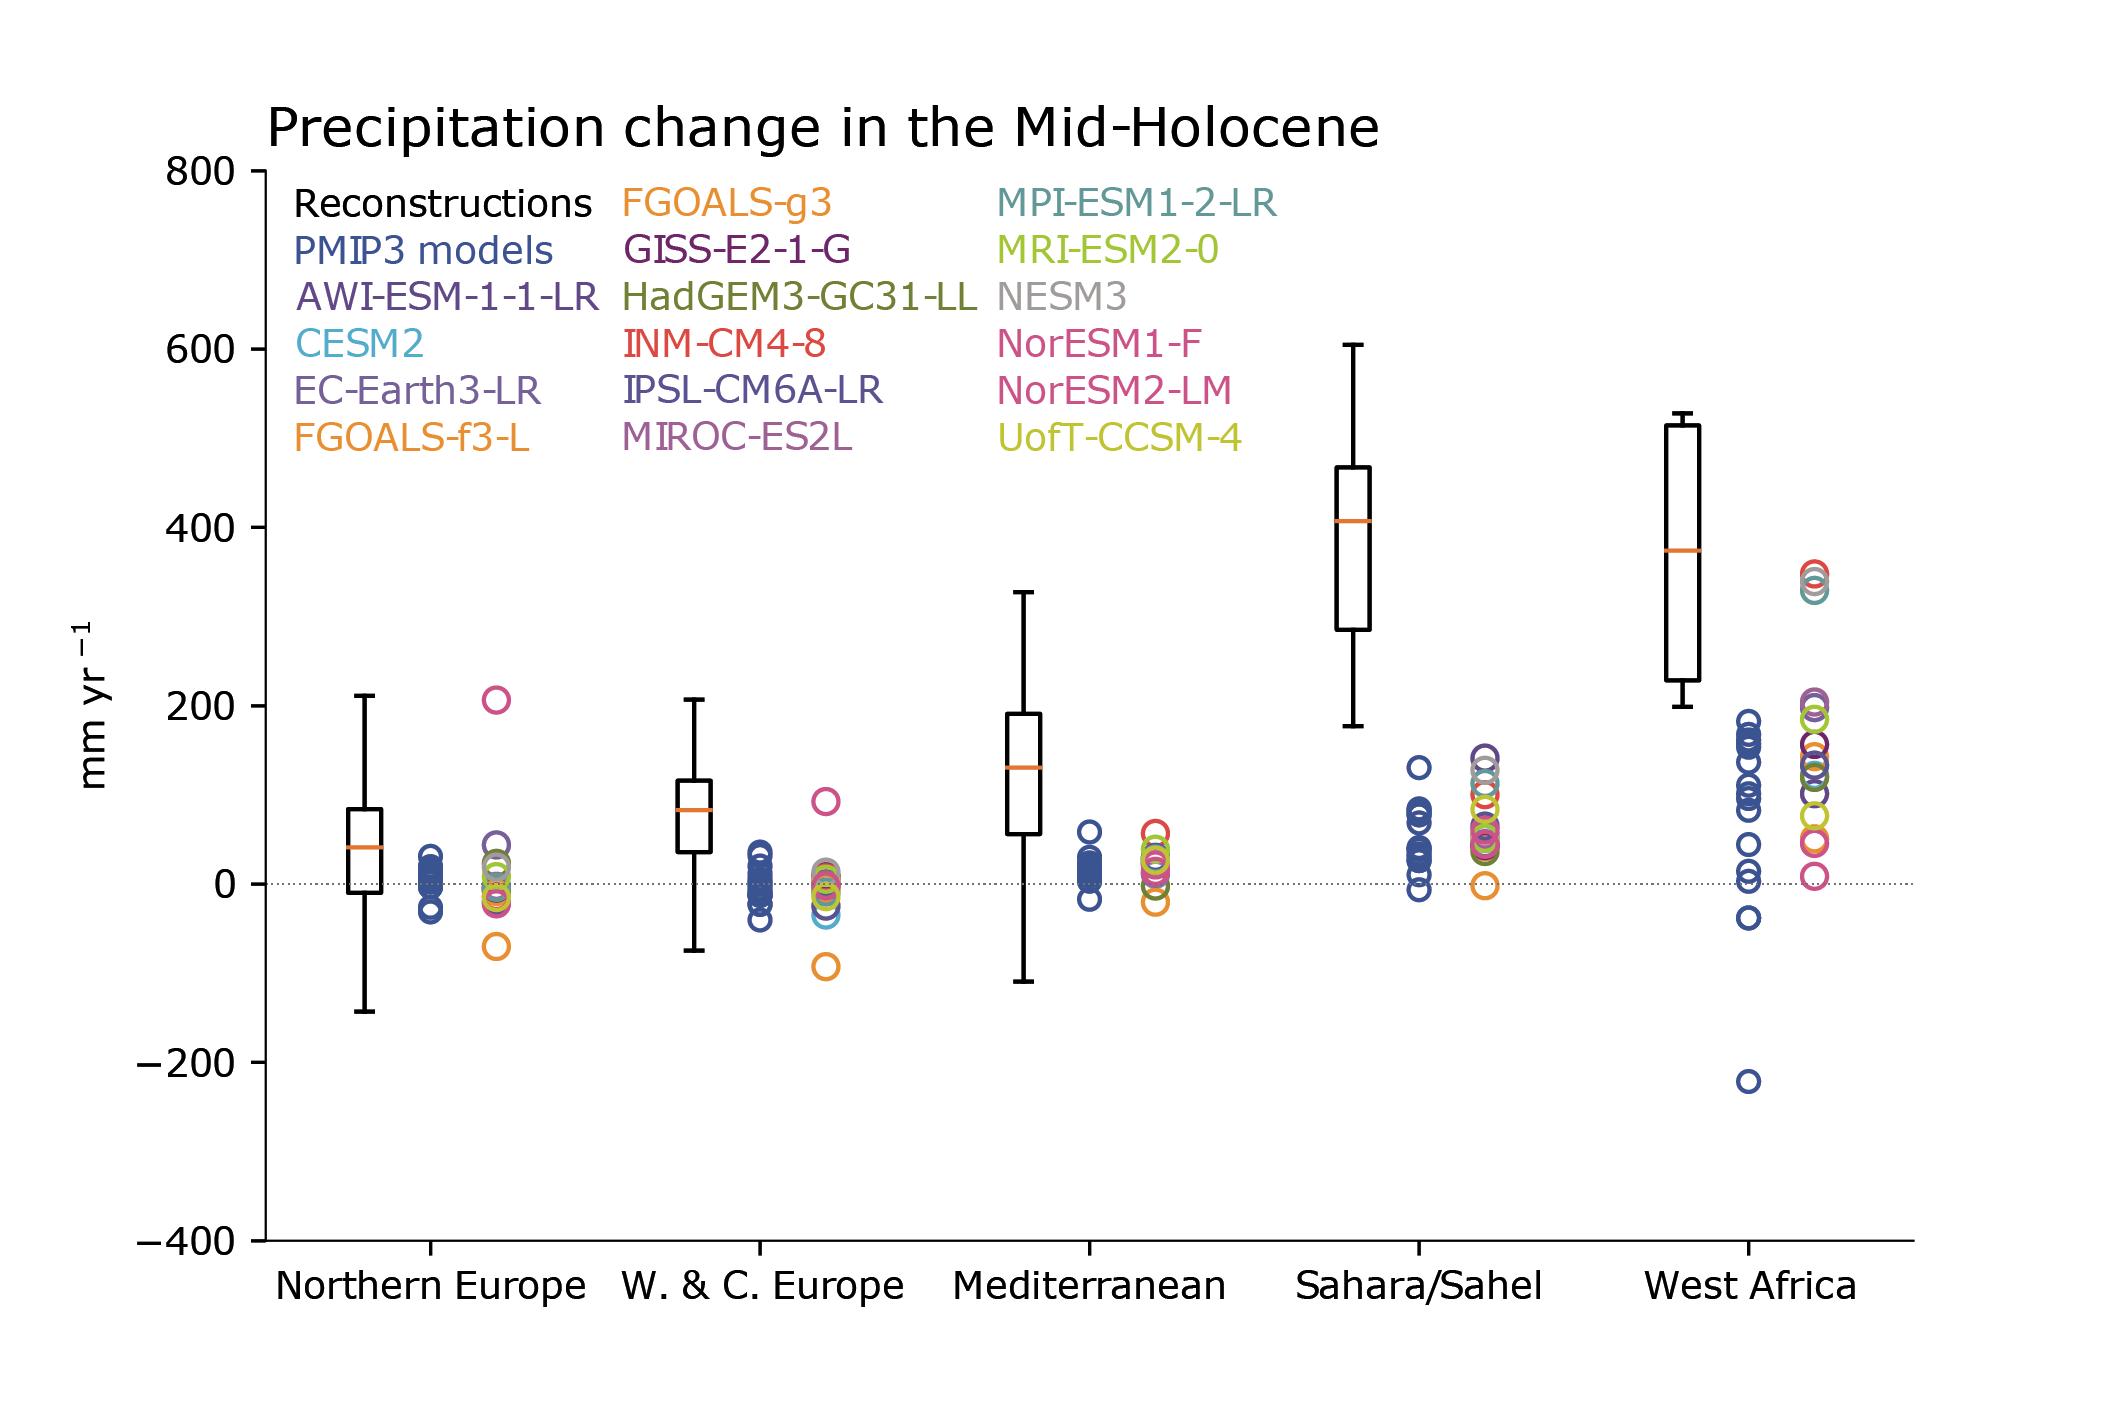
Figure caption
Figure 3.11 | Comparison between simulated annual precipitation changes and pollen-based reconstructions in the mid-Holocene (6000 years ago). The area-averaged changes relative to the pre-industrial control simulations over five regions (Iturbide et al., 2020) as simulated by CMIP6 models (individually identifiable, one ensemble member per model) and CMIP5 models (blue) are shown, stretching from the tropics to high-latitudes. All regions contain multiple quantitative reconstructions of changes relative to present day; their interquartile range are shown by boxes and with whiskers for their full range excluding outliers. Figure is adapted from Brierley et al. (2020). Further details on data sources and processing are available in the chapter data table (Table 3.SM.1).