Back chapter figures
Figure 3.12
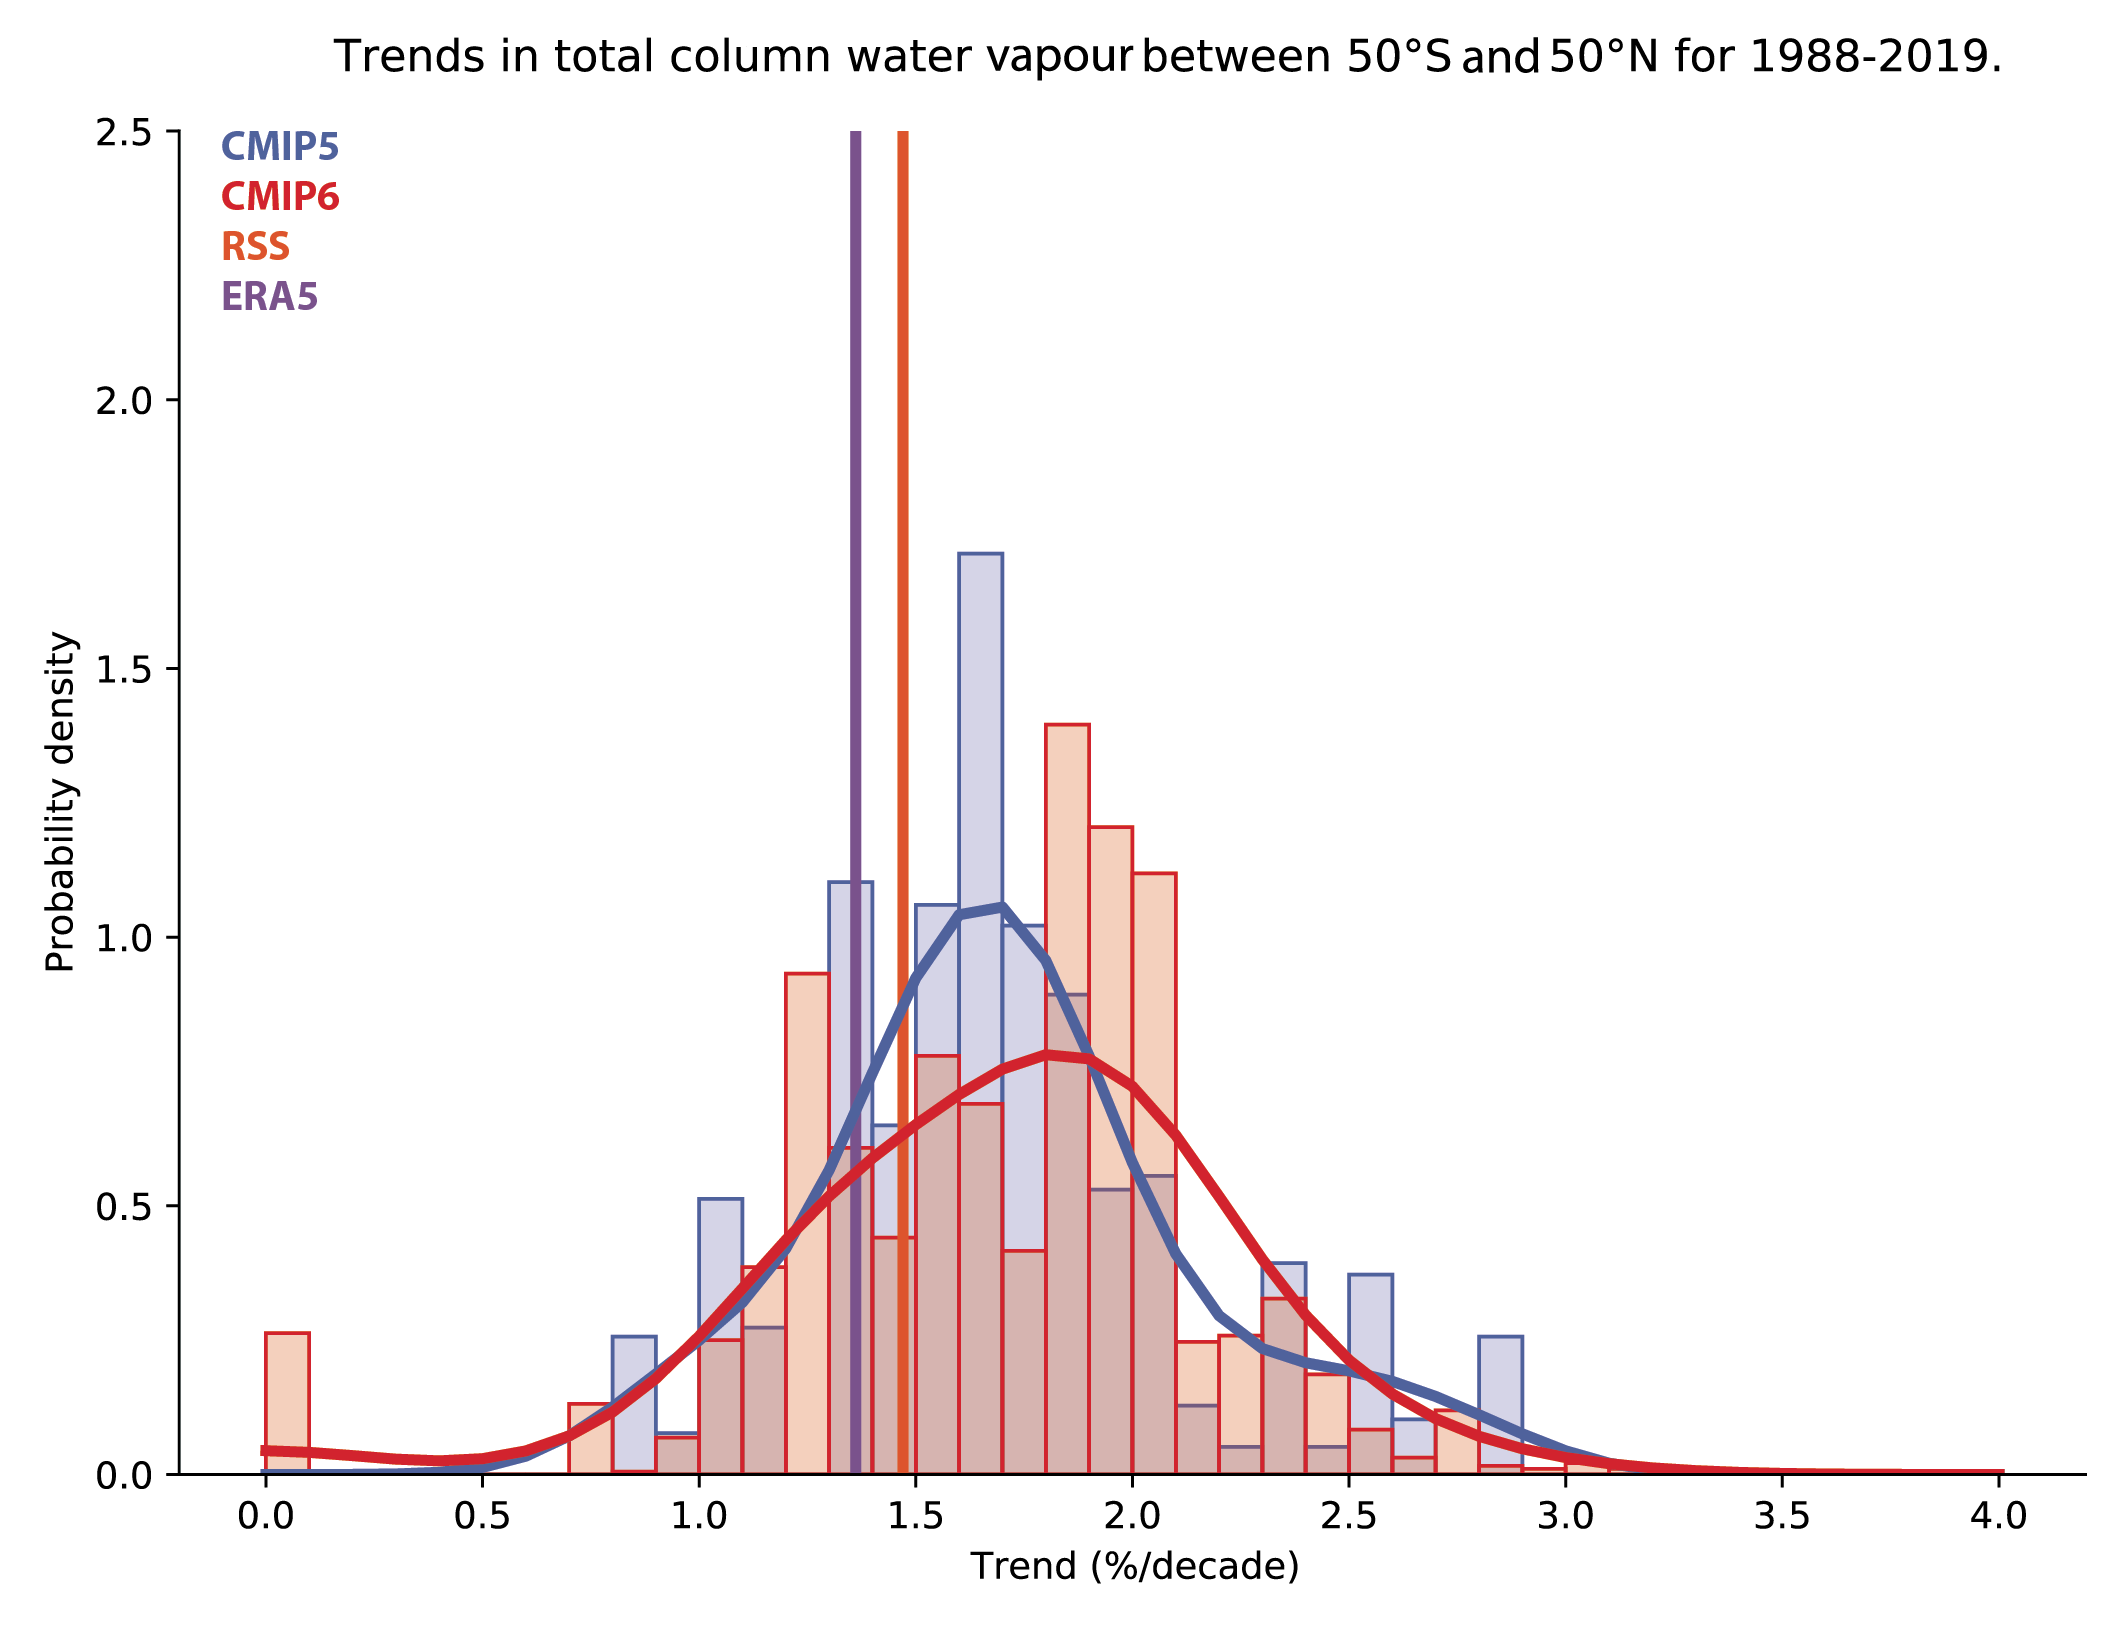
Figure caption
Figure 3.12 | Total column water vapour trends (% per decade) for the period 1988–2019 averaged over the near-global oceans (50°S–50°N). The figure shows satellite data (RSS) and ERA5.1 reanalysis, as well as CMIP5 (blue) and CMIP6 (red) historical simulations. All available ensemble members were used (see Section 3.2). Fits to the model trend probability distributions were performed with kernel density estimation. Figure is updated from Santer et al. (2007). Further details on data sources and processing are available in the chapter data table (Table 3.SM.1).