Back chapter figures
Figure 3.14
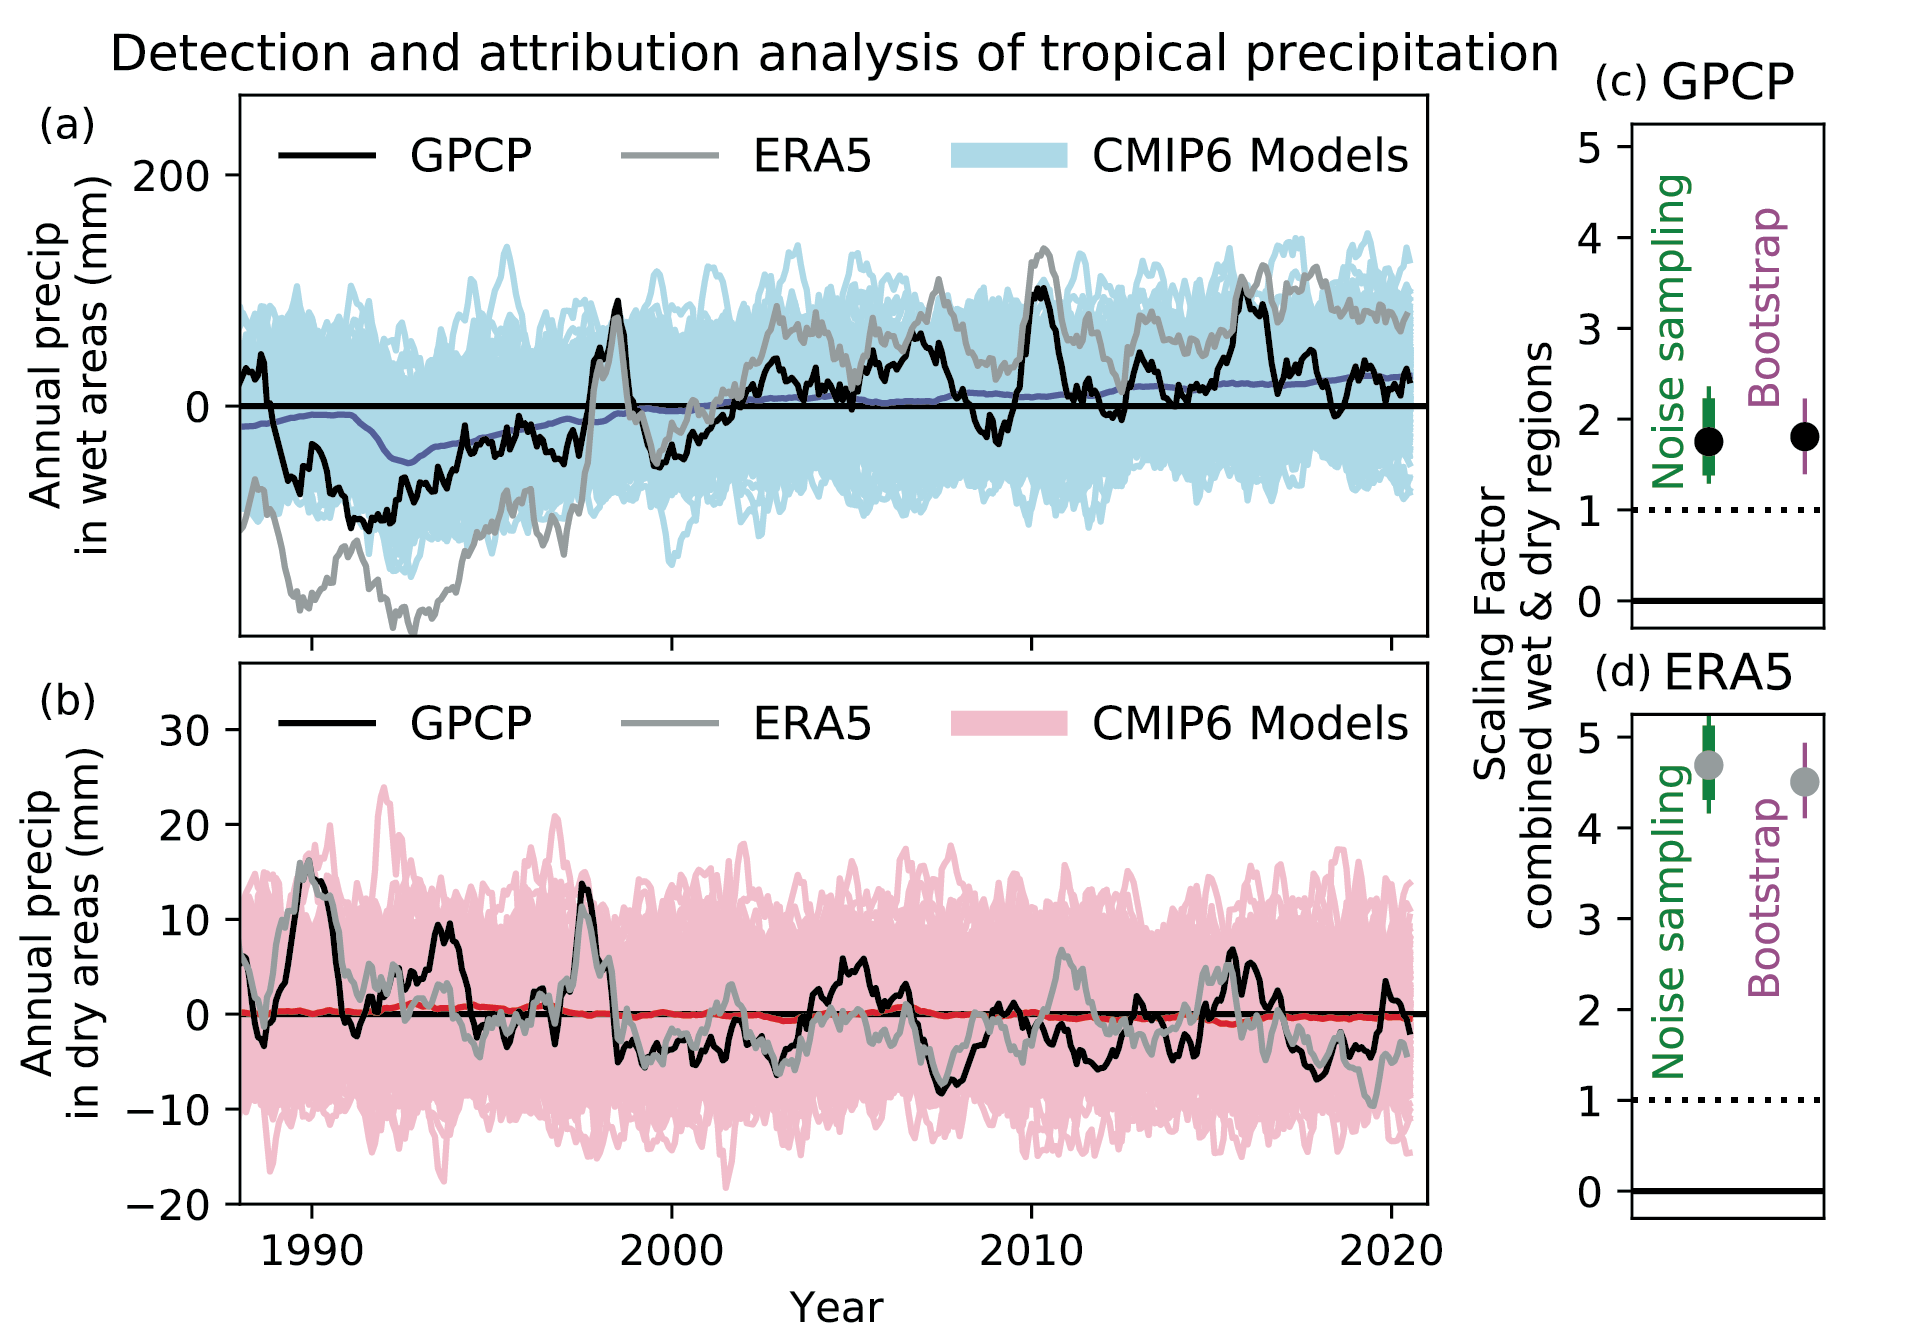
Figure caption
Figure 3.14 | Wet (a) and dry (b) region tropical mean (30°S–30°N) annual precipitation anomalies. Observed data are shown with black lines (GPCP), ERA5 reanalysis is shown in grey, single model simulations are shown with light blue/red lines (CMIP6), and multi-model mean results are shown with dark blue/red lines (CMIP6). Wet and dry region annual anomalies are calculated as the running mean over 12 months relative to a 1988–2020 base period. The regions are defined as the wettest third and driest third of the surface area, calculated for the observations and for each model separately for each season (following Polson and Hegerl, 2017). Scaling factors (c, d) are calculated for the combination of the wet and dry region mean, where the observations, reanalysis and all the model simulations are first standardized using the mean standard deviation of the pre-industrial control simulations. Two total least squares regression methods are used: noise in variables (following Polson and Hegerl, 2017) which estimates a best estimate and a 5–95% confidence interval using the pre-industrial controls (circle and thick green line) and the pre-industrial controls with double the variance (thin green line); and a bootstrap method (DelSole et al., 2019) (5–95% confidence interval shown with a purple line and best estimate with a circle). Panel (c) shows results for GPCP and panel (d) for ERA5. Figure is adapted from Schurer et al. (2020). Further details on data sources and processing are available in the chapter data table (Table 3.SM.1).