Back chapter figures
Figure 3.15
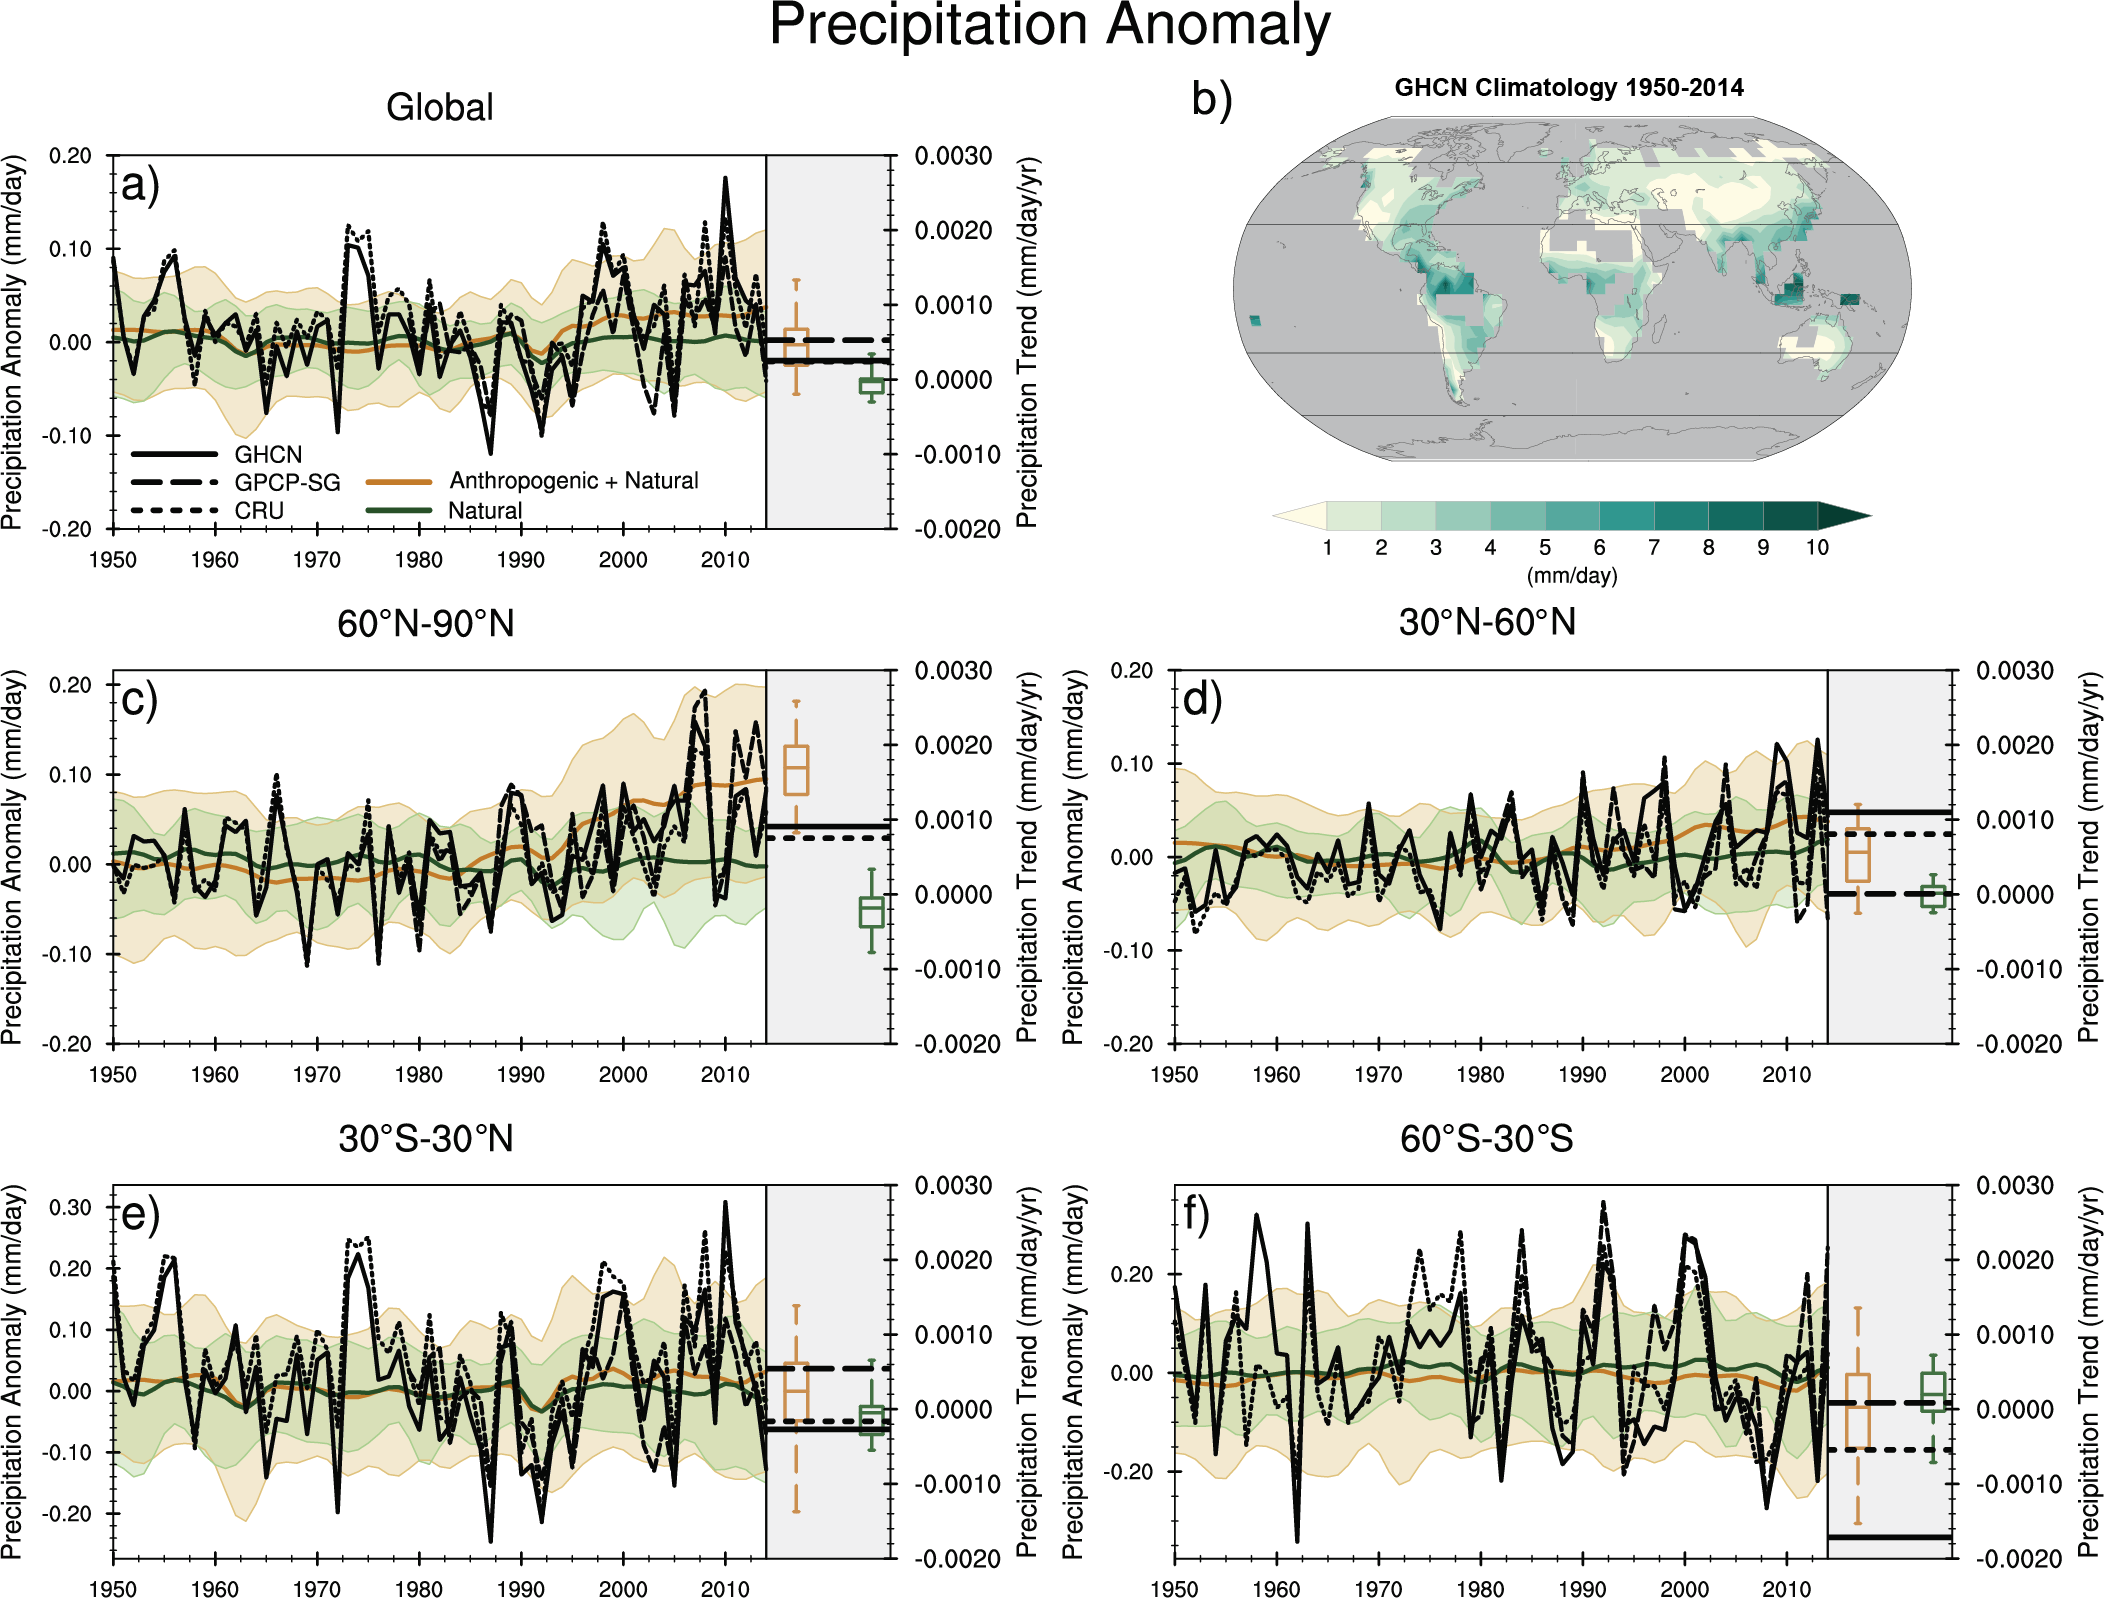
Figure caption
Figure 3.15 | Observed and simulated time series of anomalies in zonal average annual mean precipitation. (a), (c–f) Evolution of global and zonal average annual mean precipitation (mm day–1) over areas of land where there are observations, expressed relative to the base period of 1961–1990, simulated by CMIP6 models (one ensemble member per model) forced with both anthropogenic and natural forcings (brown) and natural forcings only (green). Multi-model means are shown in thick solid lines and shading shows the 5–95% confidence interval of the individual model simulations. The data is smoothed using a low pass filter. Observations from three different datasets are included: gridded values derived from Global Historical Climatology Network (GHCN version 2) station data, updated from Zhang et al. (2007), data from the Global Precipitation Climatology Product (GPCP L3 version 2.3, Adler et al. (2003)) and from the Climate Research Unit (CRU TS4.02, Harris et al. (2014)). Also plotted are boxplots showing interquartile and 5–95% ranges of simulated trends over the period for simulations forced with both anthropogenic and natural forcings (brown) and natural forcings only (blue). Observed trends for each observational product are shown as horizontal lines. Panel (b) shows annual mean precipitation rate (mm day–1) of GHCN version 2 for the years 1950–2014 over land areas used to compute the plots. Further details on data sources and processing are available in the chapter data table (Table 3.SM.1).