Back chapter figures
Figure 3.16
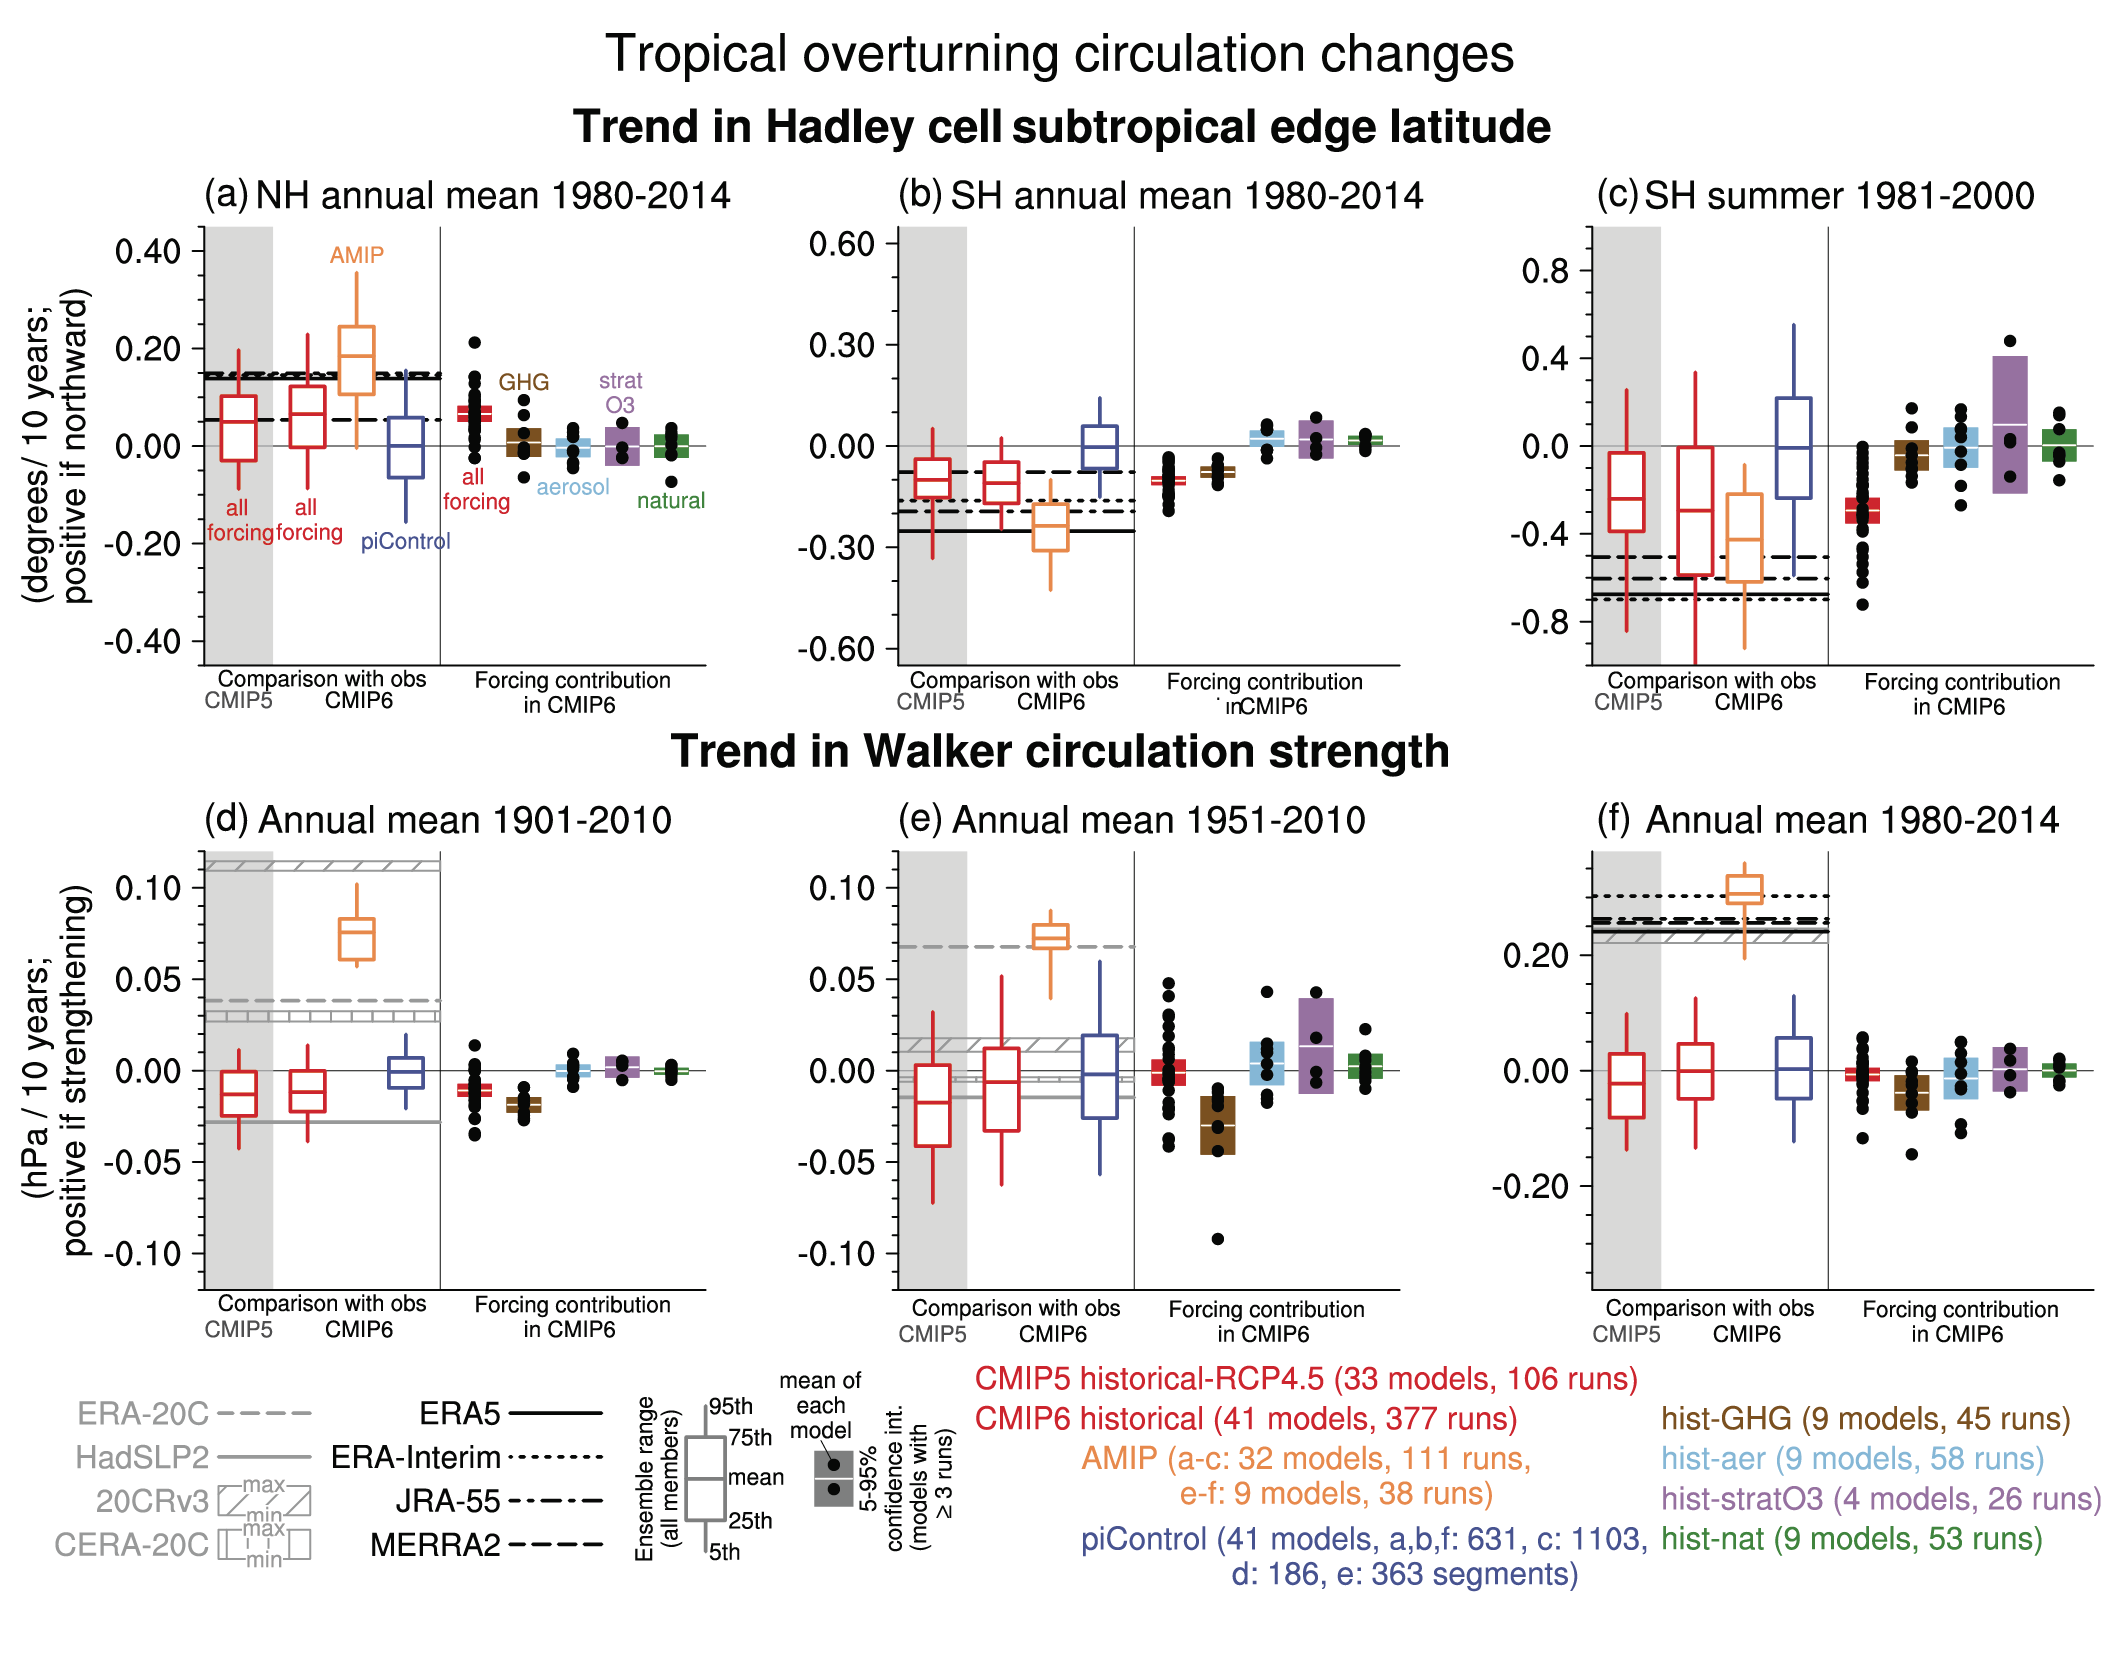
Figure caption
Figure 3.16 | Model evaluation and attribution of changes in Hadley cell extent and Walker circulation strength. (a–c) Trends in subtropical edge latitude of the Hadley cells in (a) the Northern Hemisphere for 1980–2014 annual means and (b, c) Southern Hemisphere for (b) 1980–2014 annual means and (c) 1980/81–1999/2000 December–January–February means. Positive values indicate northward shifts. (d–f) Trends in the Pacific Walker circulation strength for (d) 1901–2010, (e) 1951–2010 and (f) 1980–2014. Positive values indicate strengthening. Based on CMIP5 historical (extended with RCP4.5), CMIP6 historical, AMIP, pre-industrial control, and single forcing simulations along with HadSLP2 and reanalyses. Pre-industrial control simulations are divided into non-overlapping segments of the same length as the other simulations. White boxes and whiskers represent means, interquartile ranges and 5th and 95th percentiles, calculated after weighting individual members with the inverse of the ensemble size of the same model, so that individual models are equally weighted Section 3.2). The filled boxes represent the 5–95% confidence interval on the multi-model mean trends of the models with at least three ensemble members, with dots indicating the ensemble means of individual models. The edge latitude of the Hadley cell is where the surface zonal wind velocity changes sign from negative to positive, as described in the Appendix of Grise et al. (2018). The Pacific Walker circulation strength is evaluated as the annual mean difference of sea level pressure between 5°S–5°N, 160°W–80°W and 5°S–5°N, 80°E–160°E. Further details on data sources and processing are available in the chapter data table (Table 3.SM.1).