Back chapter figures
Figure 3.2
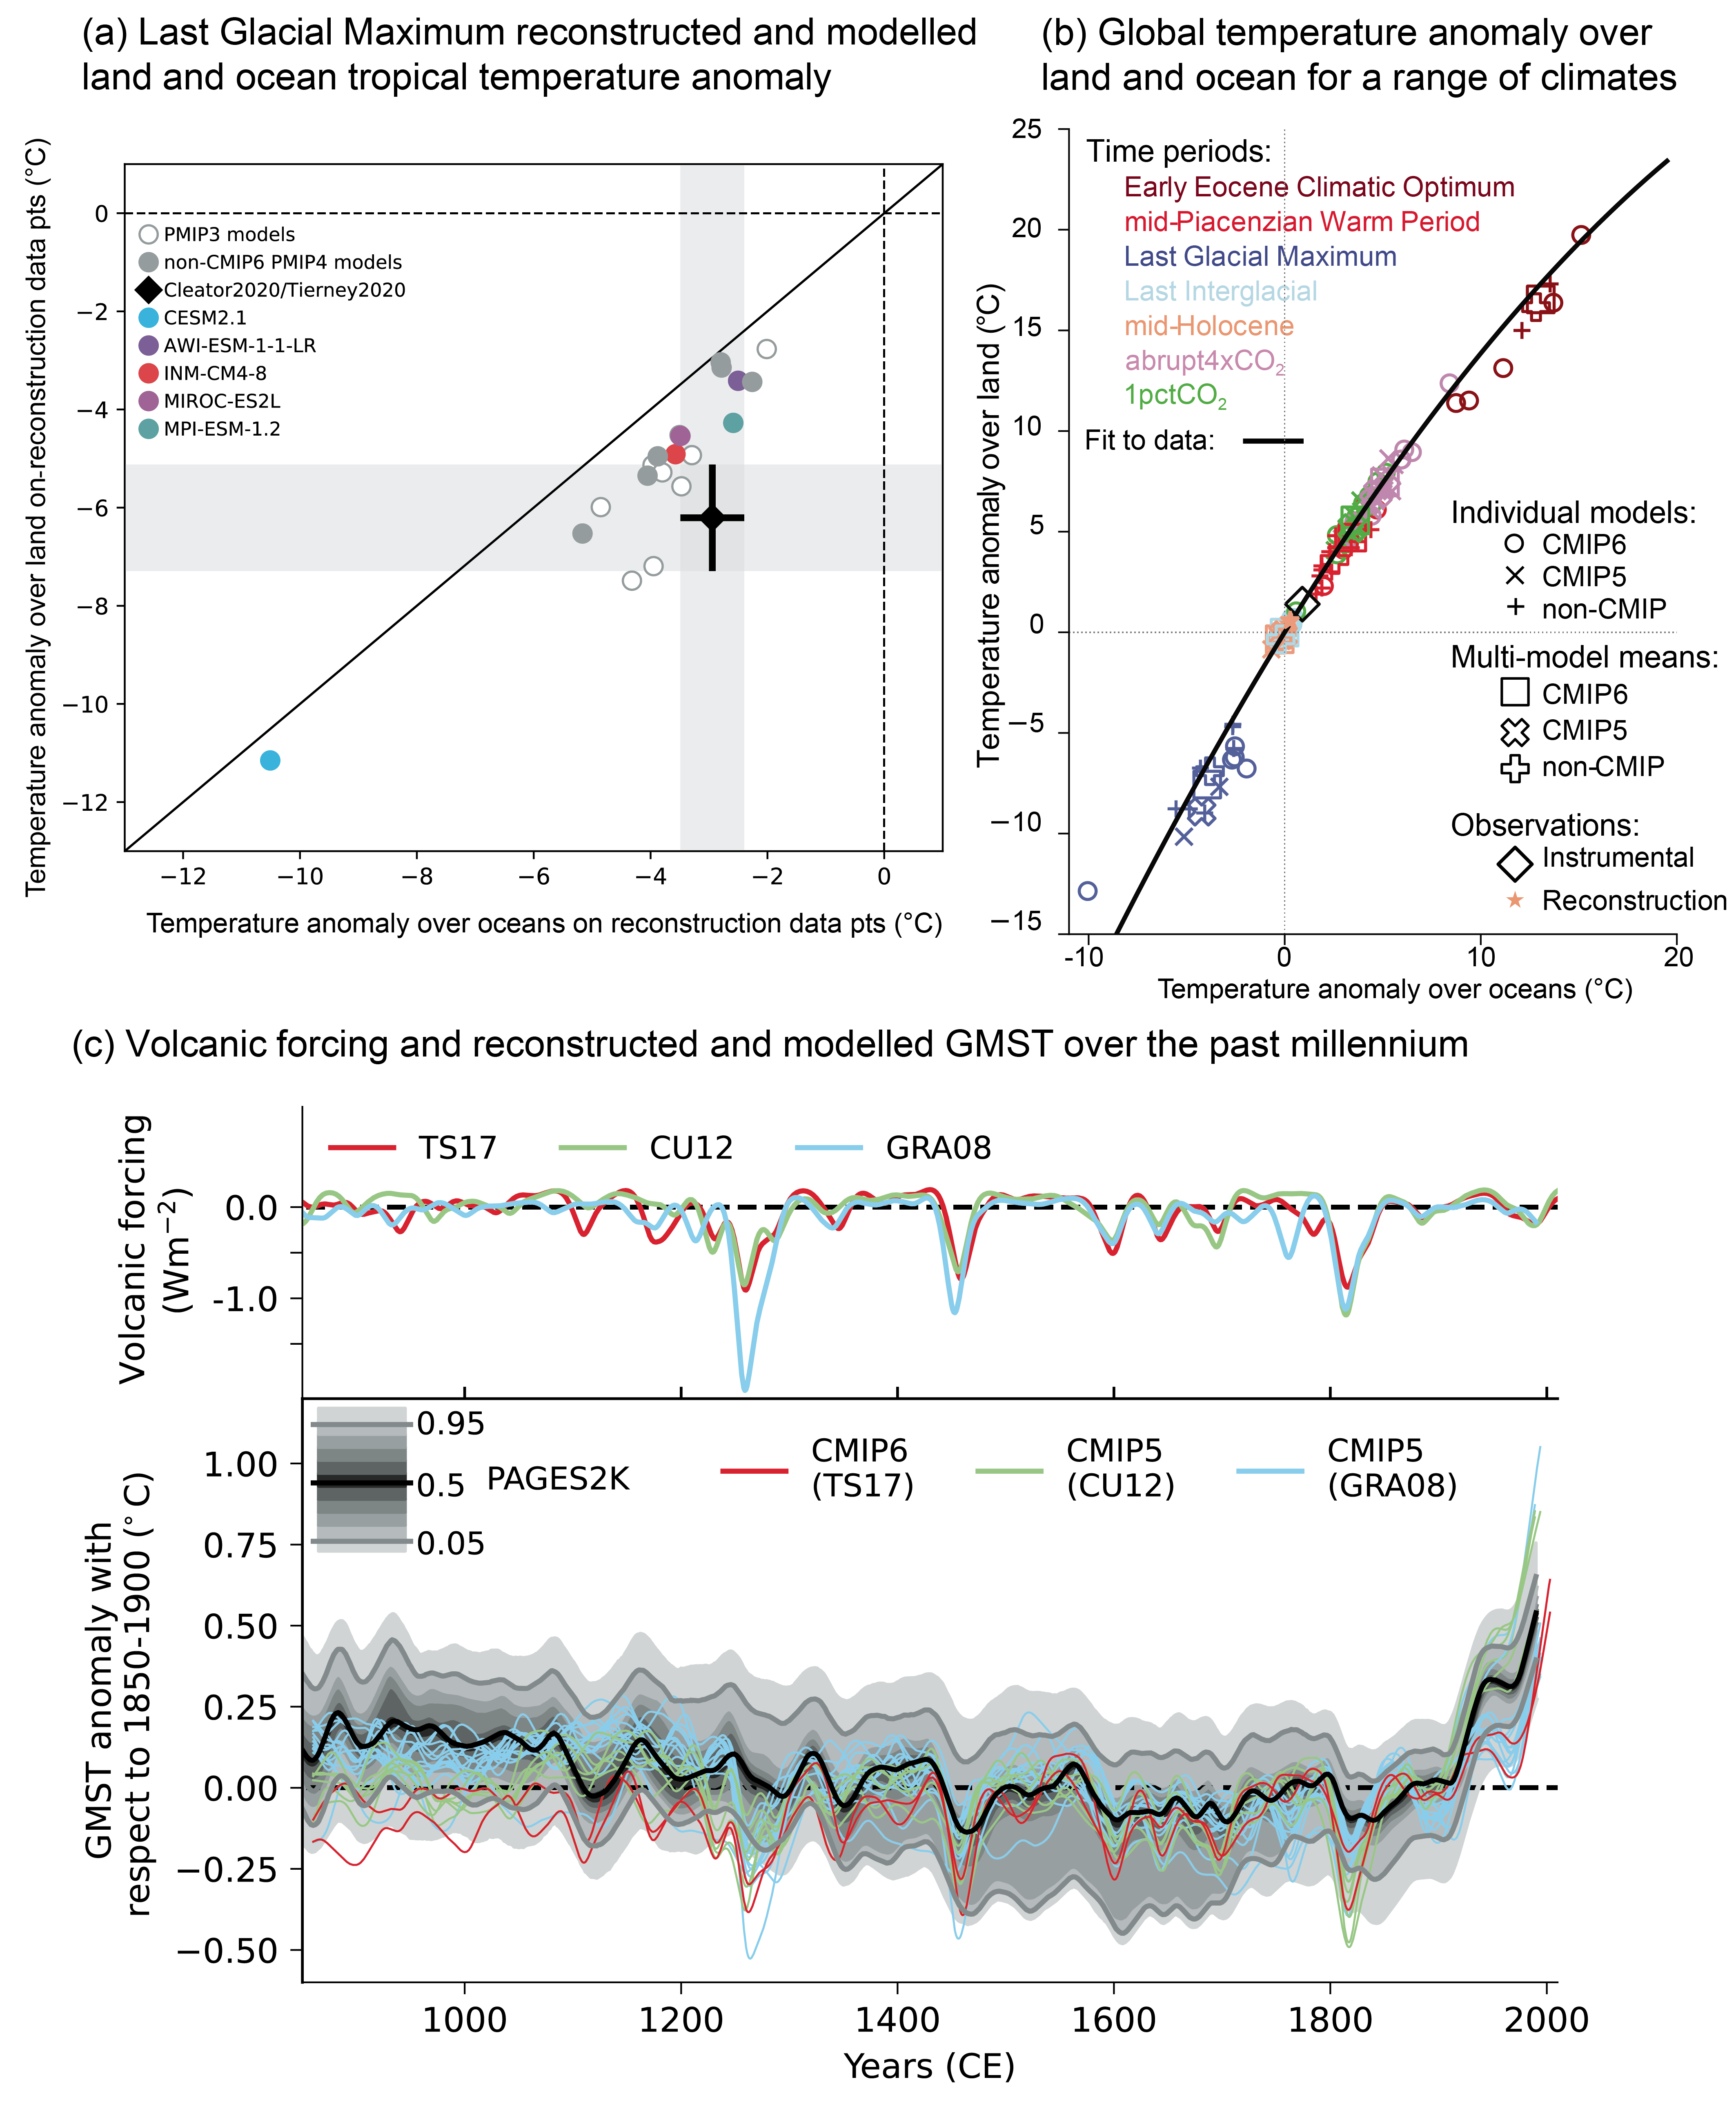
Figure caption
Figure 3.2 | Changes in surface temperature for different paleoclimates. (a) Comparison of reconstructed and modelled surface temperature anomalies for the Last Glacial Maximum over land and ocean in the Tropics (30°N–30°S). Land-based reconstructions are from Cleator et al. (2020). Ocean-based reconstructions are from Tierney et al. (2020b). Model anomalies are calculated as the difference between Last Glacial Maximum and pre-industrial control simulations of the PMIP3 and PMIP4 ensembles, sampled at the reconstruction data points. (b) Land–sea contrast in global mean surface temperature change for different paleoclimates. Small symbols show individual model simulations from the CMIP5 and CMIP6 ensembles. Large symbols show ensemble means and assessed values. (c) Upper panel shows time series of volcanic radiative forcing, in W m−2, as used in the CMIP5 (Gao et al., 2008; Crowley and Unterman, 2013; see also Schmidt et al., 2011) and CMIP6 (850 CE to 1900 CE from Toohey and Sigl (2017), 1850–2015 from Luo (2018)). The forcing was calculated from the stratospheric aerosol optical depth at 550 nm shown in Figure 2.2. Lower panel shows time series of global mean surface temperature anomalies, in °C, with respect to 1850–1900 for the CMIP5 and CMIP6 past1000 simulations and their historical continuation simulations. Simulations are coloured according to the volcanic radiative forcing dataset they used. The median reconstruction of temperature from PAGES 2k Consortium (2019) is shown in black, the 5–95% confidence interval is shown by grey lines and the grey envelopes show the 1st, 5th, 15th, 25th, 35th, 45th, 55th, 65th, 75th, 85th, 95th, and 99th percentiles. All data in both panels are band-passed filtered, where frequencies longer than 20 years have been retained. Further details on data sources and processing are available in the chapter data table (Table 3.SM.1).