Back chapter figures
Figure 3.20
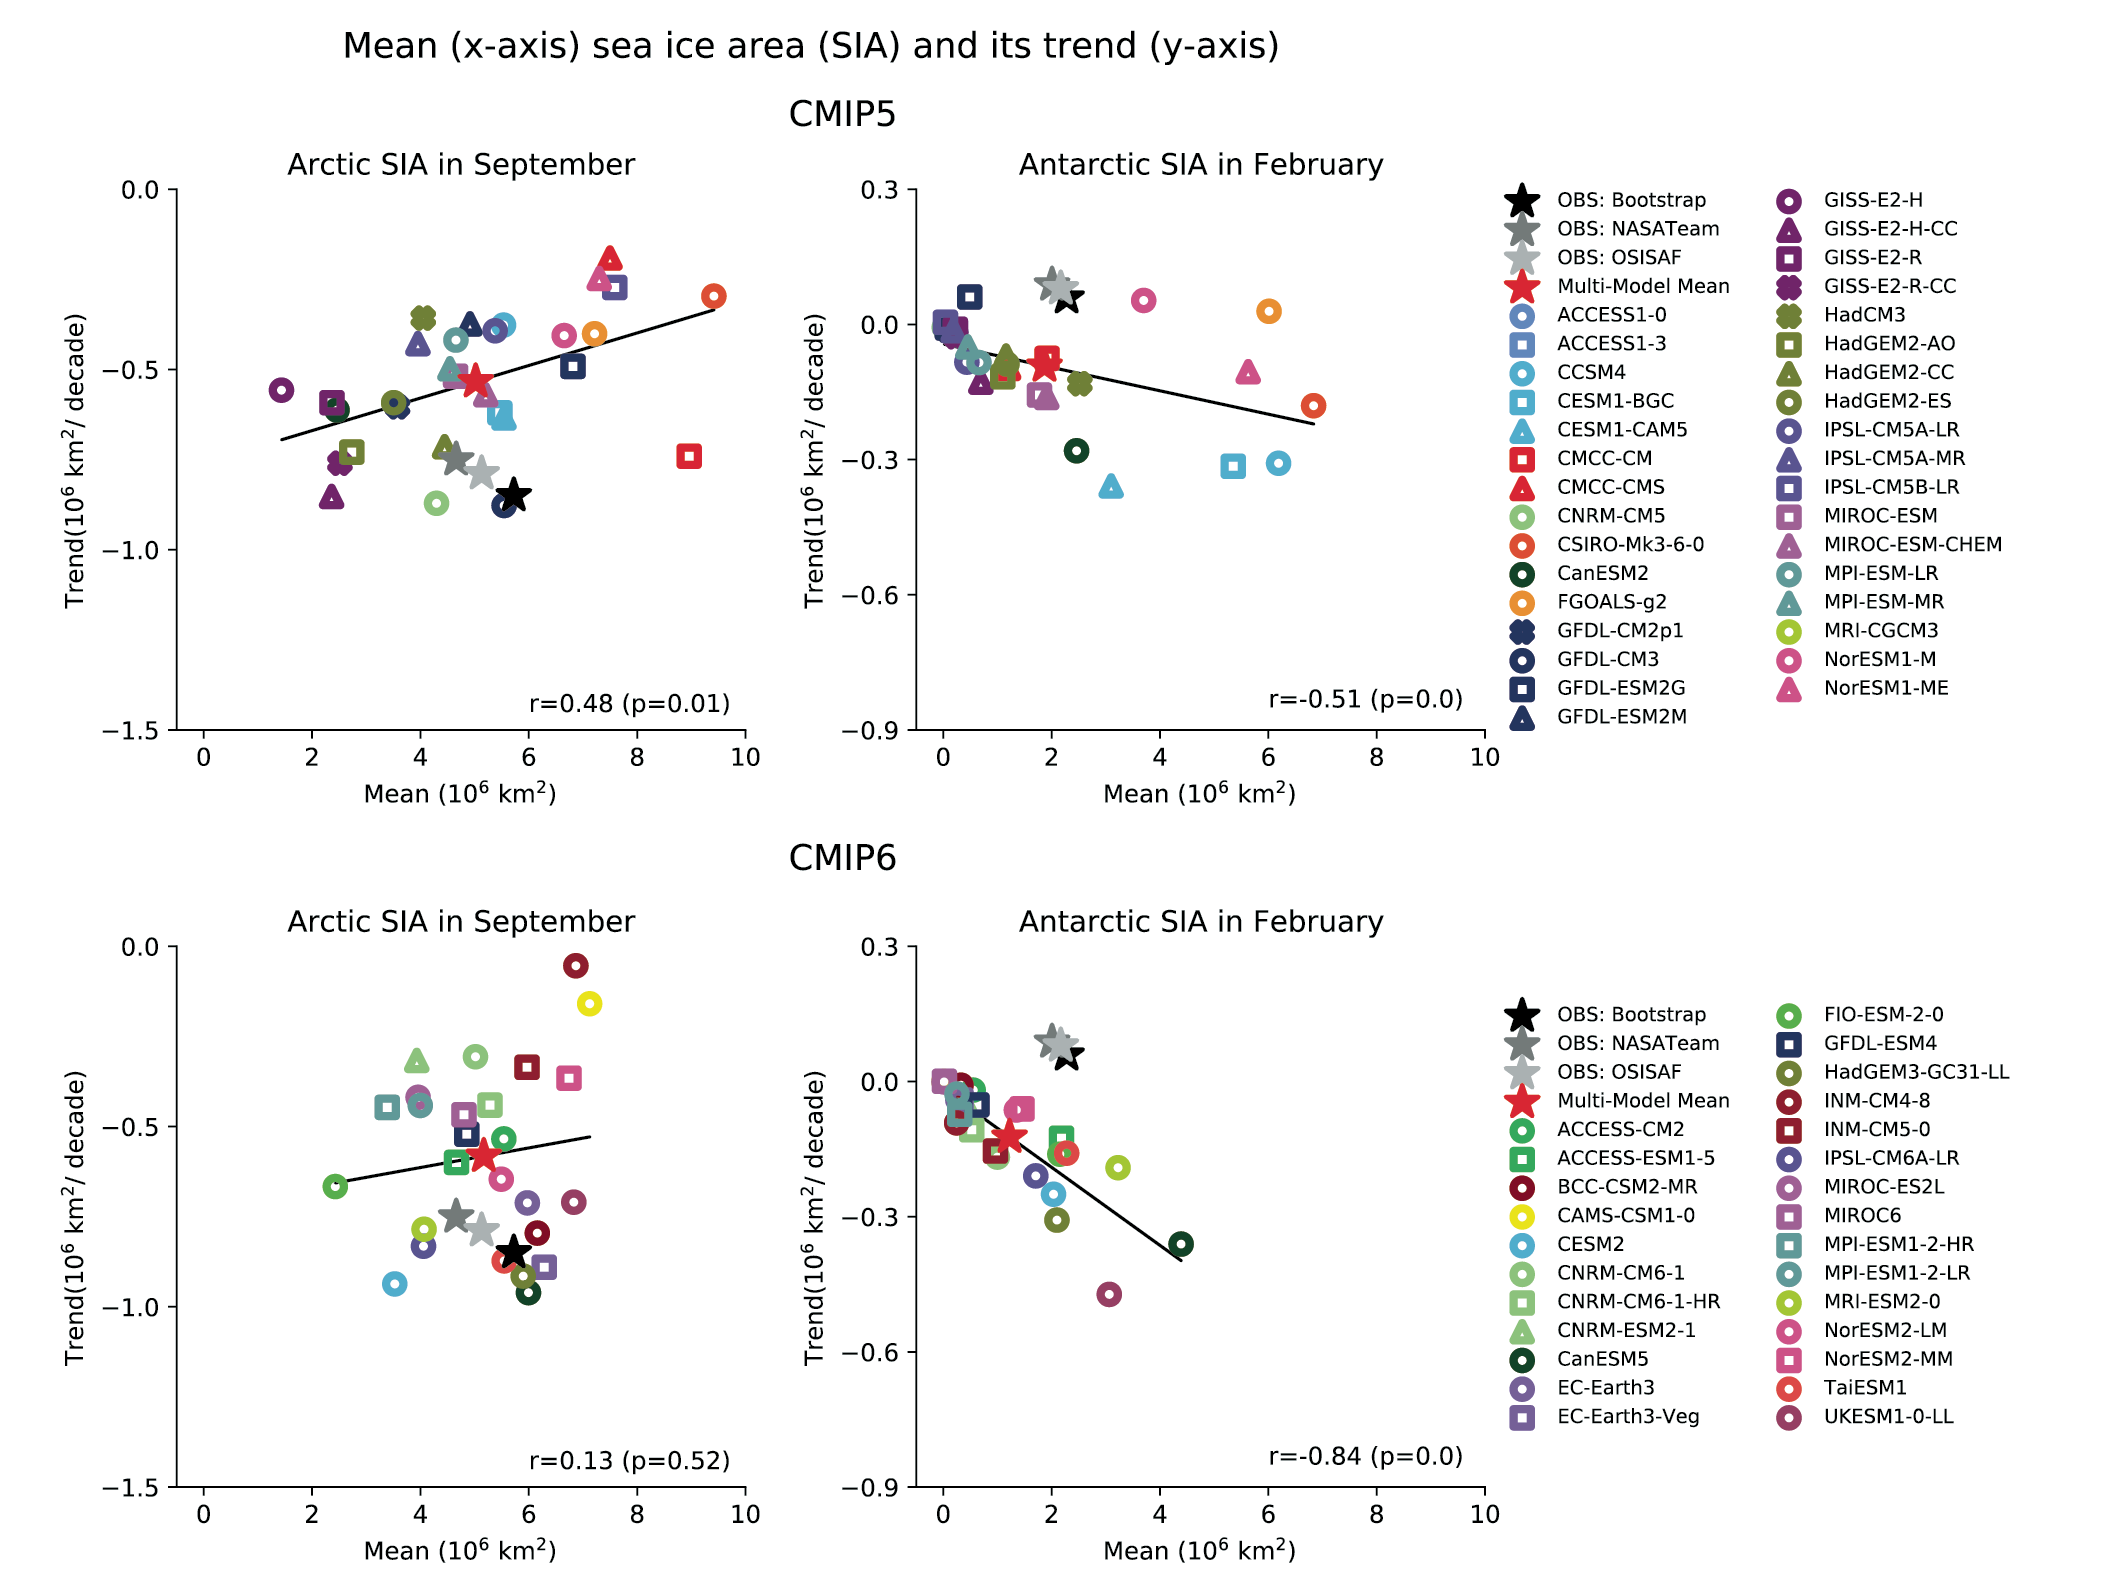
Figure caption
Figure 3.20 | Mean (x-axis) and trend (y-axis) of Arctic sea ice area (SIA) in September (left) and Antarctic SIA in February (right) for 1979–2017 from CMIP5 (upper) and CMIP6 (lower) models. All individual models (ensemble means) and the multi-model mean values are compared with the observations (OSISAF, NASA Team, and Bootstrap; see Figure 9.13). Solid line indicates a linear regression slope with corresponding correlation coefficient (r) and p-value provided. Note the different scales used on the y-axis for Arctic and Antarctic SIA. Results remain essentially the same when using sea ice extent (SIE; not shown). Further details on data sources and processing are available in the chapter data table (Table 3.SM.1).