Back chapter figures
Figure 3.21
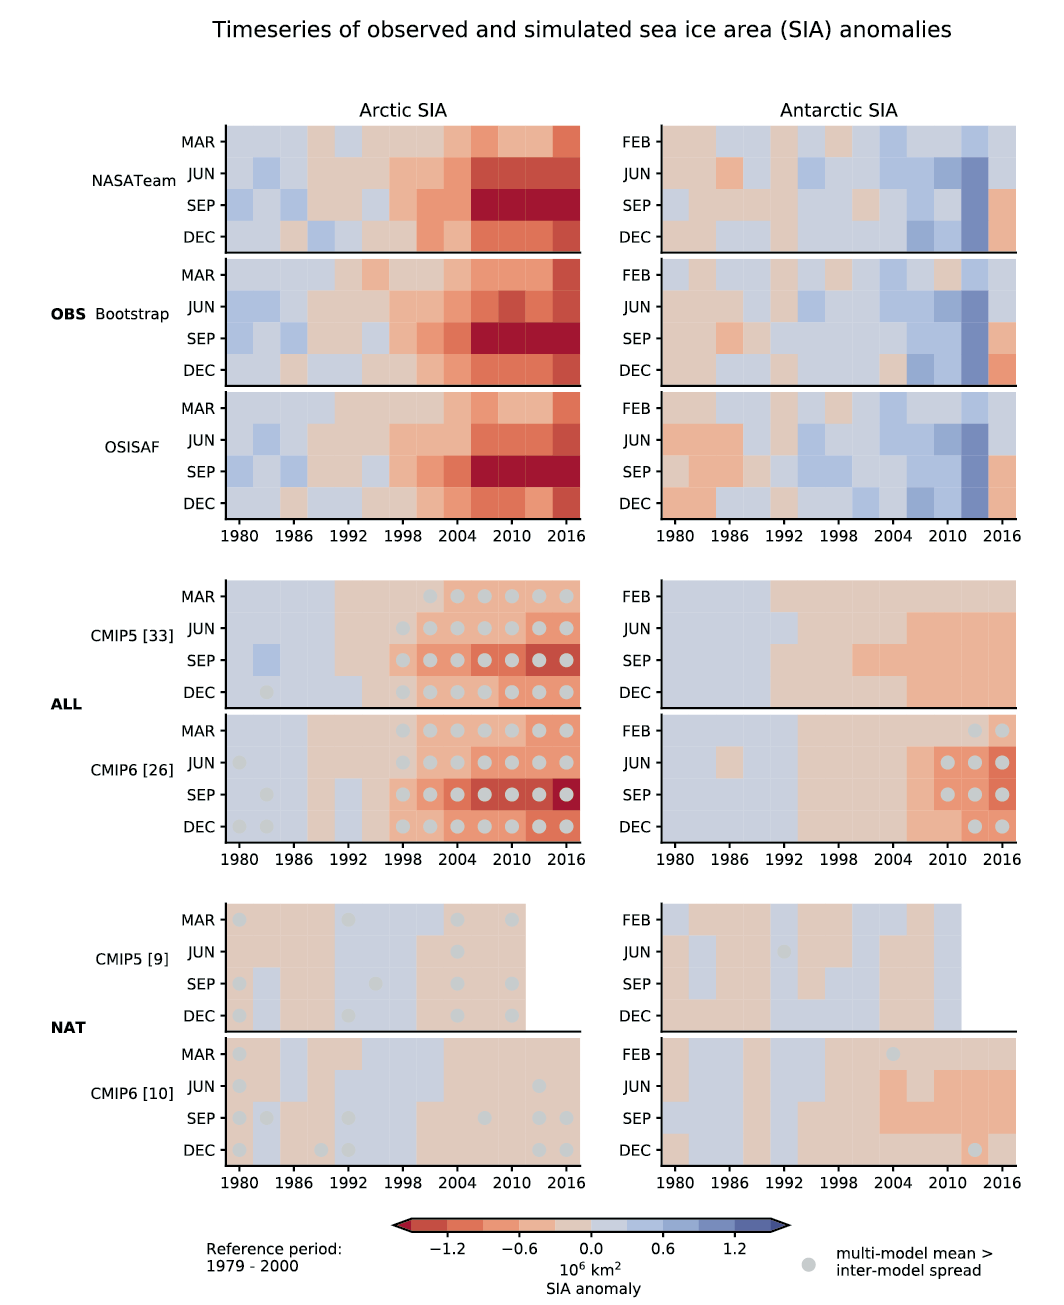
Figure caption
Figure 3.21 | Seasonal evolution of observed and simulated Arctic (left) and Antarctic (right) sea ice area (SIA) over 1979–2017. SIA anomalies relative to the 1979–2000 means from observations (OBS from OSISAF, NASA Team, and Bootstrap, top) and historical (ALL, middle) and natural only (NAT, bottom) simulations from CMIP5 and CMIP6 models. These anomalies are obtained by computing non-overlapping three-year mean SIA anomalies for March (February for Antarctic SIA), June, September, and December separately. CMIP5 historical simulations are extended by using RCP4.5 scenario simulations after 2005 while CMIP6 historical simulations are extended by using SSP2-4.5 scenario simulations after 2014. CMIP5 NAT simulations end in 2012. Numbers in brackets represent the number of models used. The multi-model mean is obtained by taking the ensemble mean for each model first and then averaging over models. Grey dots indicate multi-model mean anomalies stronger than inter-model spread (beyond ± 1 standard deviation). Results remain very similar when based on sea ice extent (SIE – not shown). Units: 106km2. Further details on data sources and processing are available in the chapter data table (Table 3.SM.1) and in the caption to Figure 9.13.