Back chapter figures
Figure 3.22
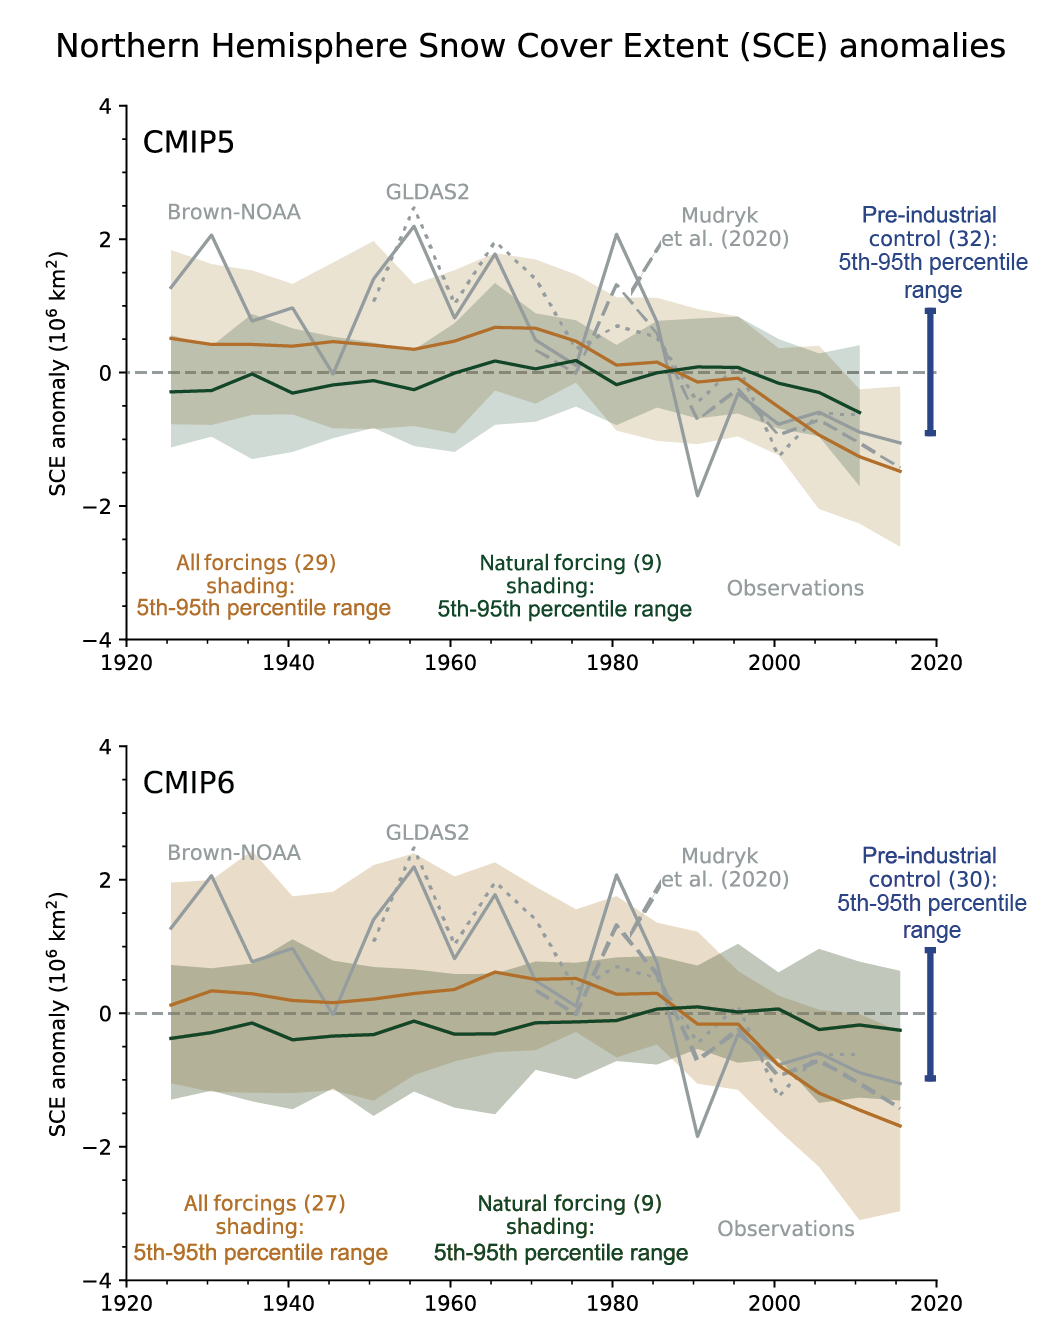
Figure caption
Figure 3.22 | Time series of Northern Hemisphere March–April mean snow cover extent (SCE) from observations, CMIP5 and CMIP6 simulations. The observations (grey lines) are updated Brown-NOAA (Brown and Robinson, 2011), Mudryk et al. (2020), and GLDAS2. CMIP5 (top) and CMIP6 (bottom) simulations of the response to natural plus anthropogenic forcing are shown in brown, natural forcing only in green, and the pre-industrial control simulation range is presented in blue. Five-year mean anomalies are shown for the 1923–2017 period with the x-axis representing the centre years of each five-year mean. CMIP5 all forcing simulations are extended by using RCP4.5 scenario simulations after 2005 while CMIP6 all forcing simulations are extended by using SSP2-4.5 scenario simulations after 2014. Shading indicates 5th–95th percentile ranges for CMIP5 and CMIP6 all and natural forcings simulations, and solid lines are ensemble means, based on all available ensemble members with equal weight given to each model Section 3.2). The blue vertical bar indicates the mean 5th–95th percentile range of pre-industrial control simulation anomalies, based on non-overlapping segments. The numbers in brackets indicate the number of models used. Anomalies are relative to the average over 1971–2000. For models, SCE is restricted to grid cells with land fraction ≥50%. Greenland is excluded from the total area summation. Figure is modified from Paik and Min (2020), their Figure 1. Further details on data sources and processing are available in the chapter data table (Table 3.SM.1).