Back chapter figures
Figure 3.23
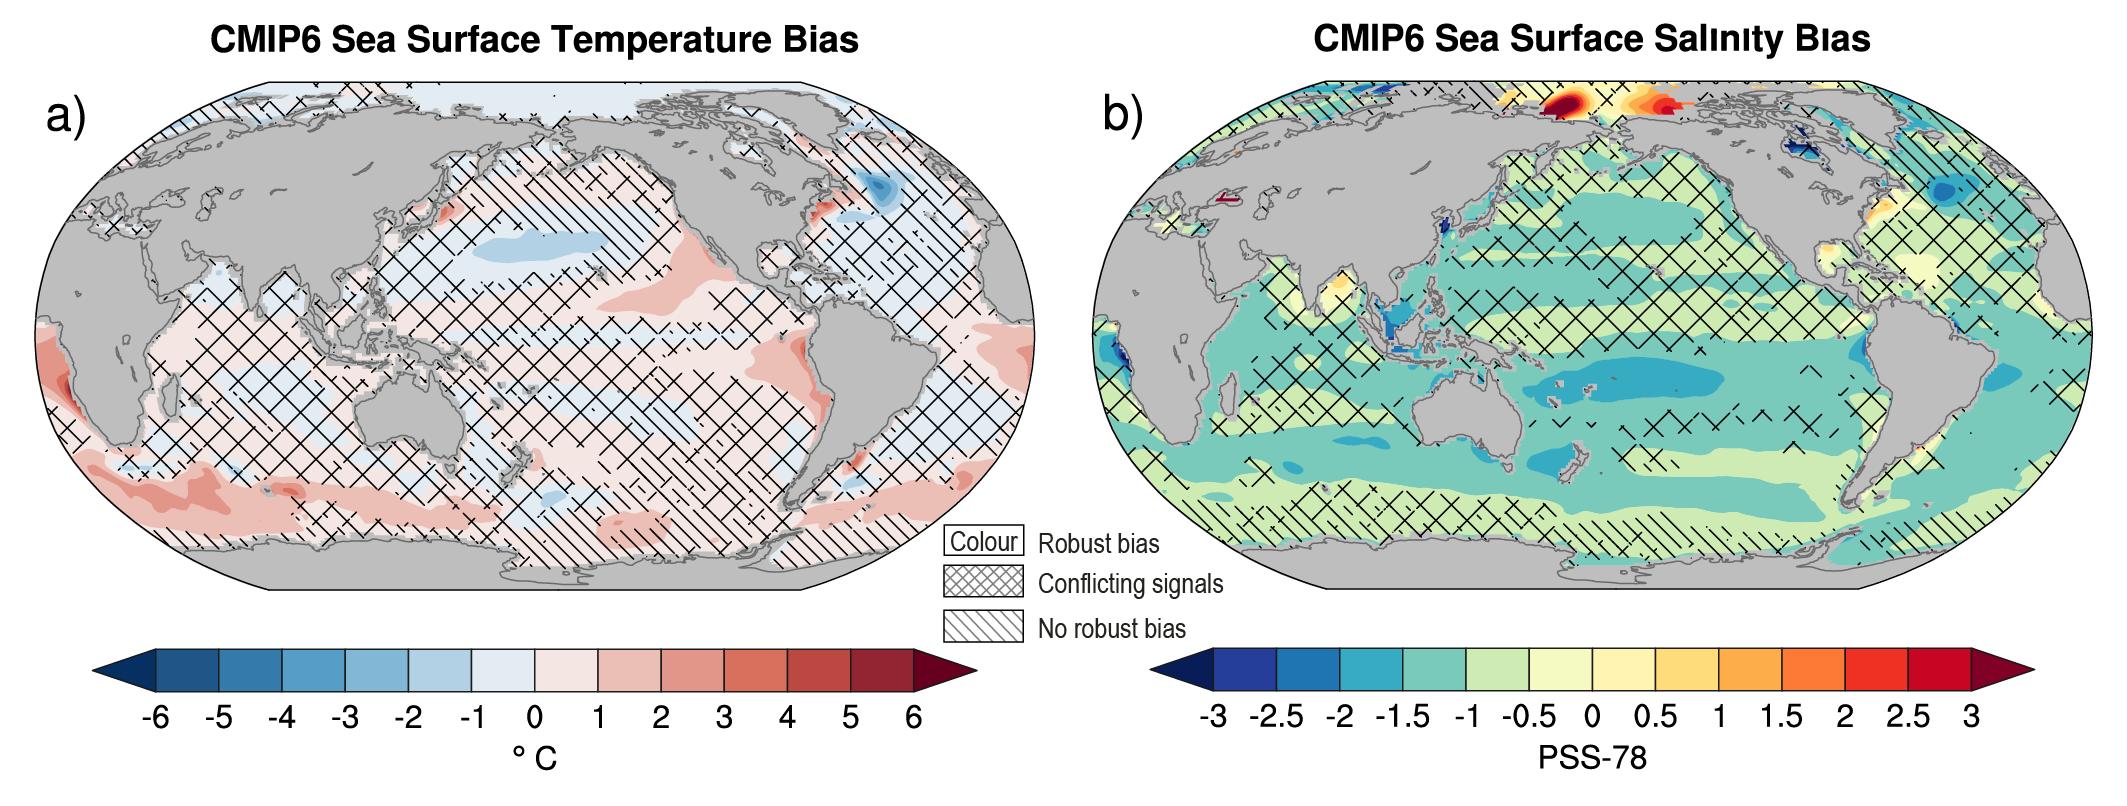
Figure caption
Figure 3.23 | Multi-model mean bias of (a) sea surface temperature and (b) near-surface salinity, defined as the difference between the CMIP6 multi-model mean and the climatology from the World Ocean Atlas 2018. The CMIP6 multi-model mean is constructed with one realization of 46 CMIP6 historical experiments for the period 1995–2014 and the climatology from the World Ocean Atlas 2018 is an average over all available years (1955–2017). Uncertainty is represented using the advanced approach: No overlay indicates regions with robust signal, where ≥66% of models show change greater than the variability threshold and ≥80% of all models agree on sign of change; diagonal lines indicate regions with no change or no robust signal, where <66% of models show a change greater than the variability threshold; crossed lines indicate regions with conflicting signal, where ≥66% of models show change greater than the variability threshold and <80% of all models agree on sign of change. For more information on the advanced approach, please refer to Cross-Chapter Box Atlas.1. Further details on data sources and processing are available in the chapter data table (Table 3.SM.1).