Back chapter figures
Figure 3.24
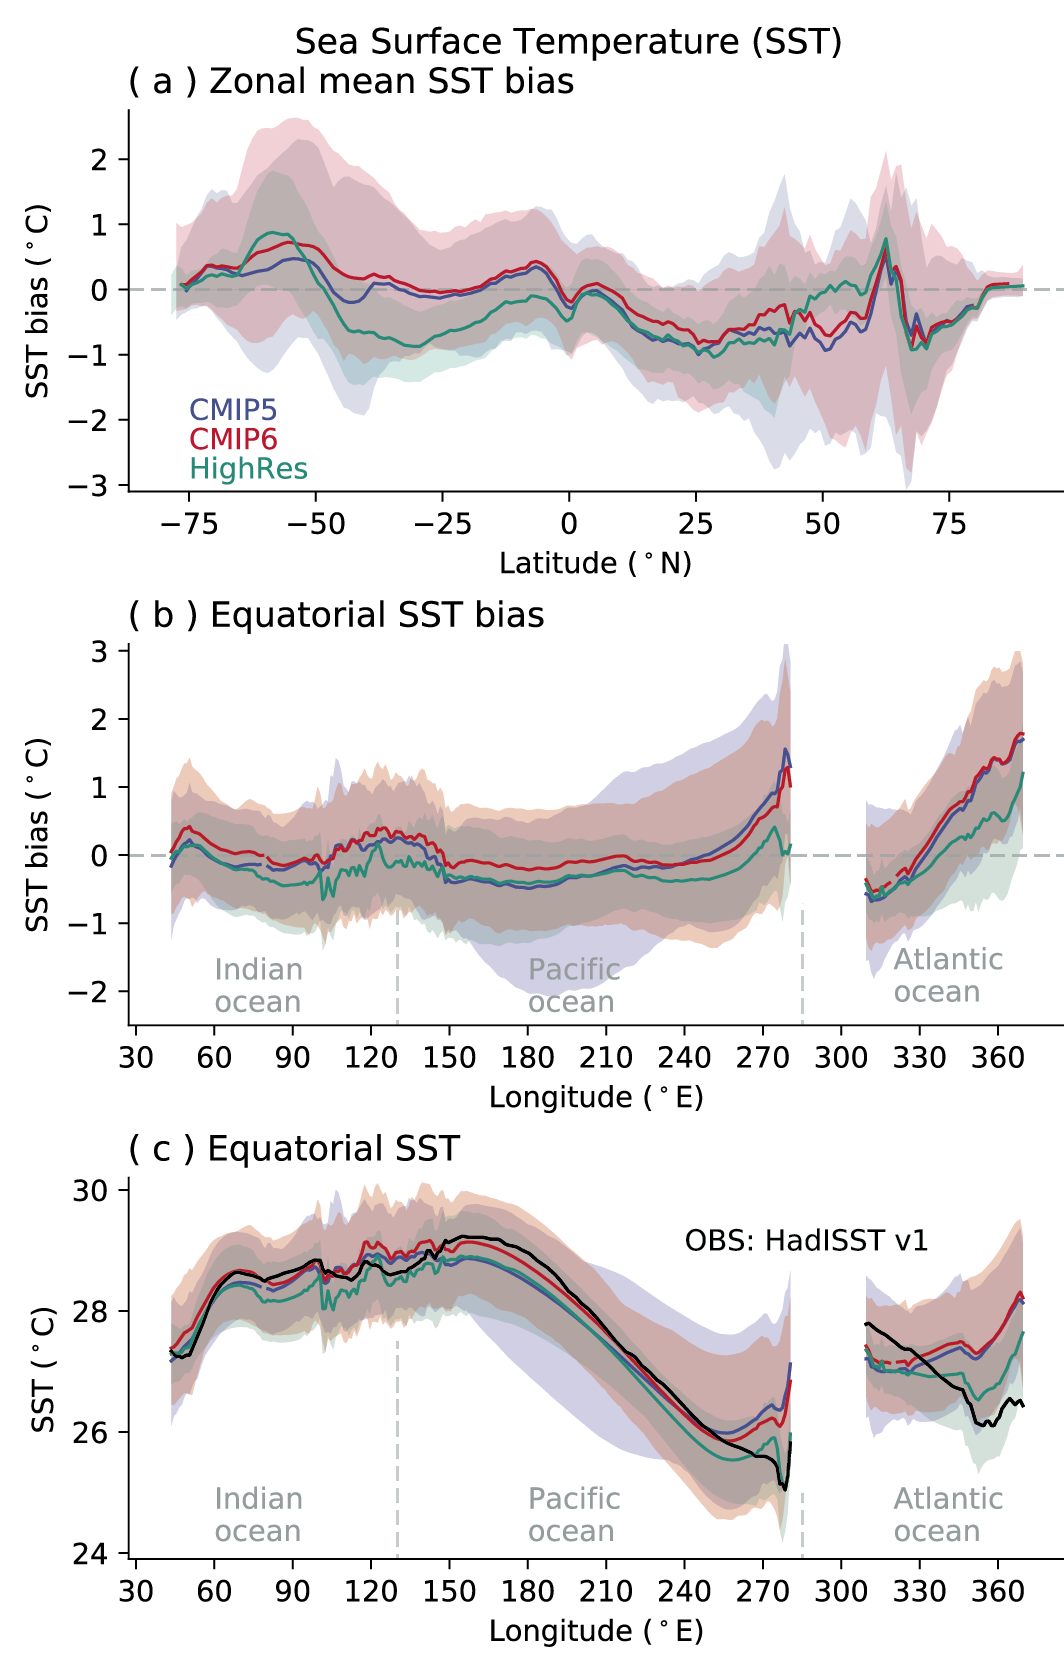
Figure caption
Figure 3.24 | Biases in zonal mean and equatorial sea surface temperature (SST) in CMIP5 and CMIP6 models. CMIP6 (red), CMIP5 (blue) and HighResMIP (green) multi-model mean (a) zonally averaged SST bias; (b) equatorial SST bias; and (c) equatorial SST compared to observed mean SST (black line) for 1979–1999. The inter-model 5th and 95th percentiles are depicted by the respective shaded range. Model climatologies are derived from the 1979–1999 mean of the historical simulations, using one simulation per model. The Hadley Centre Sea Ice and Sea Surface Temperature version 1 (HadISST) (Rayner et al., 2003) observational climatology for 1979–1999 is used as the reference for the error calculation in (a) and (b); and for observations in (c). Further details on data sources and processing are available in the chapter data table (Table 3.SM.1).