Back chapter figures
Figure 3.25
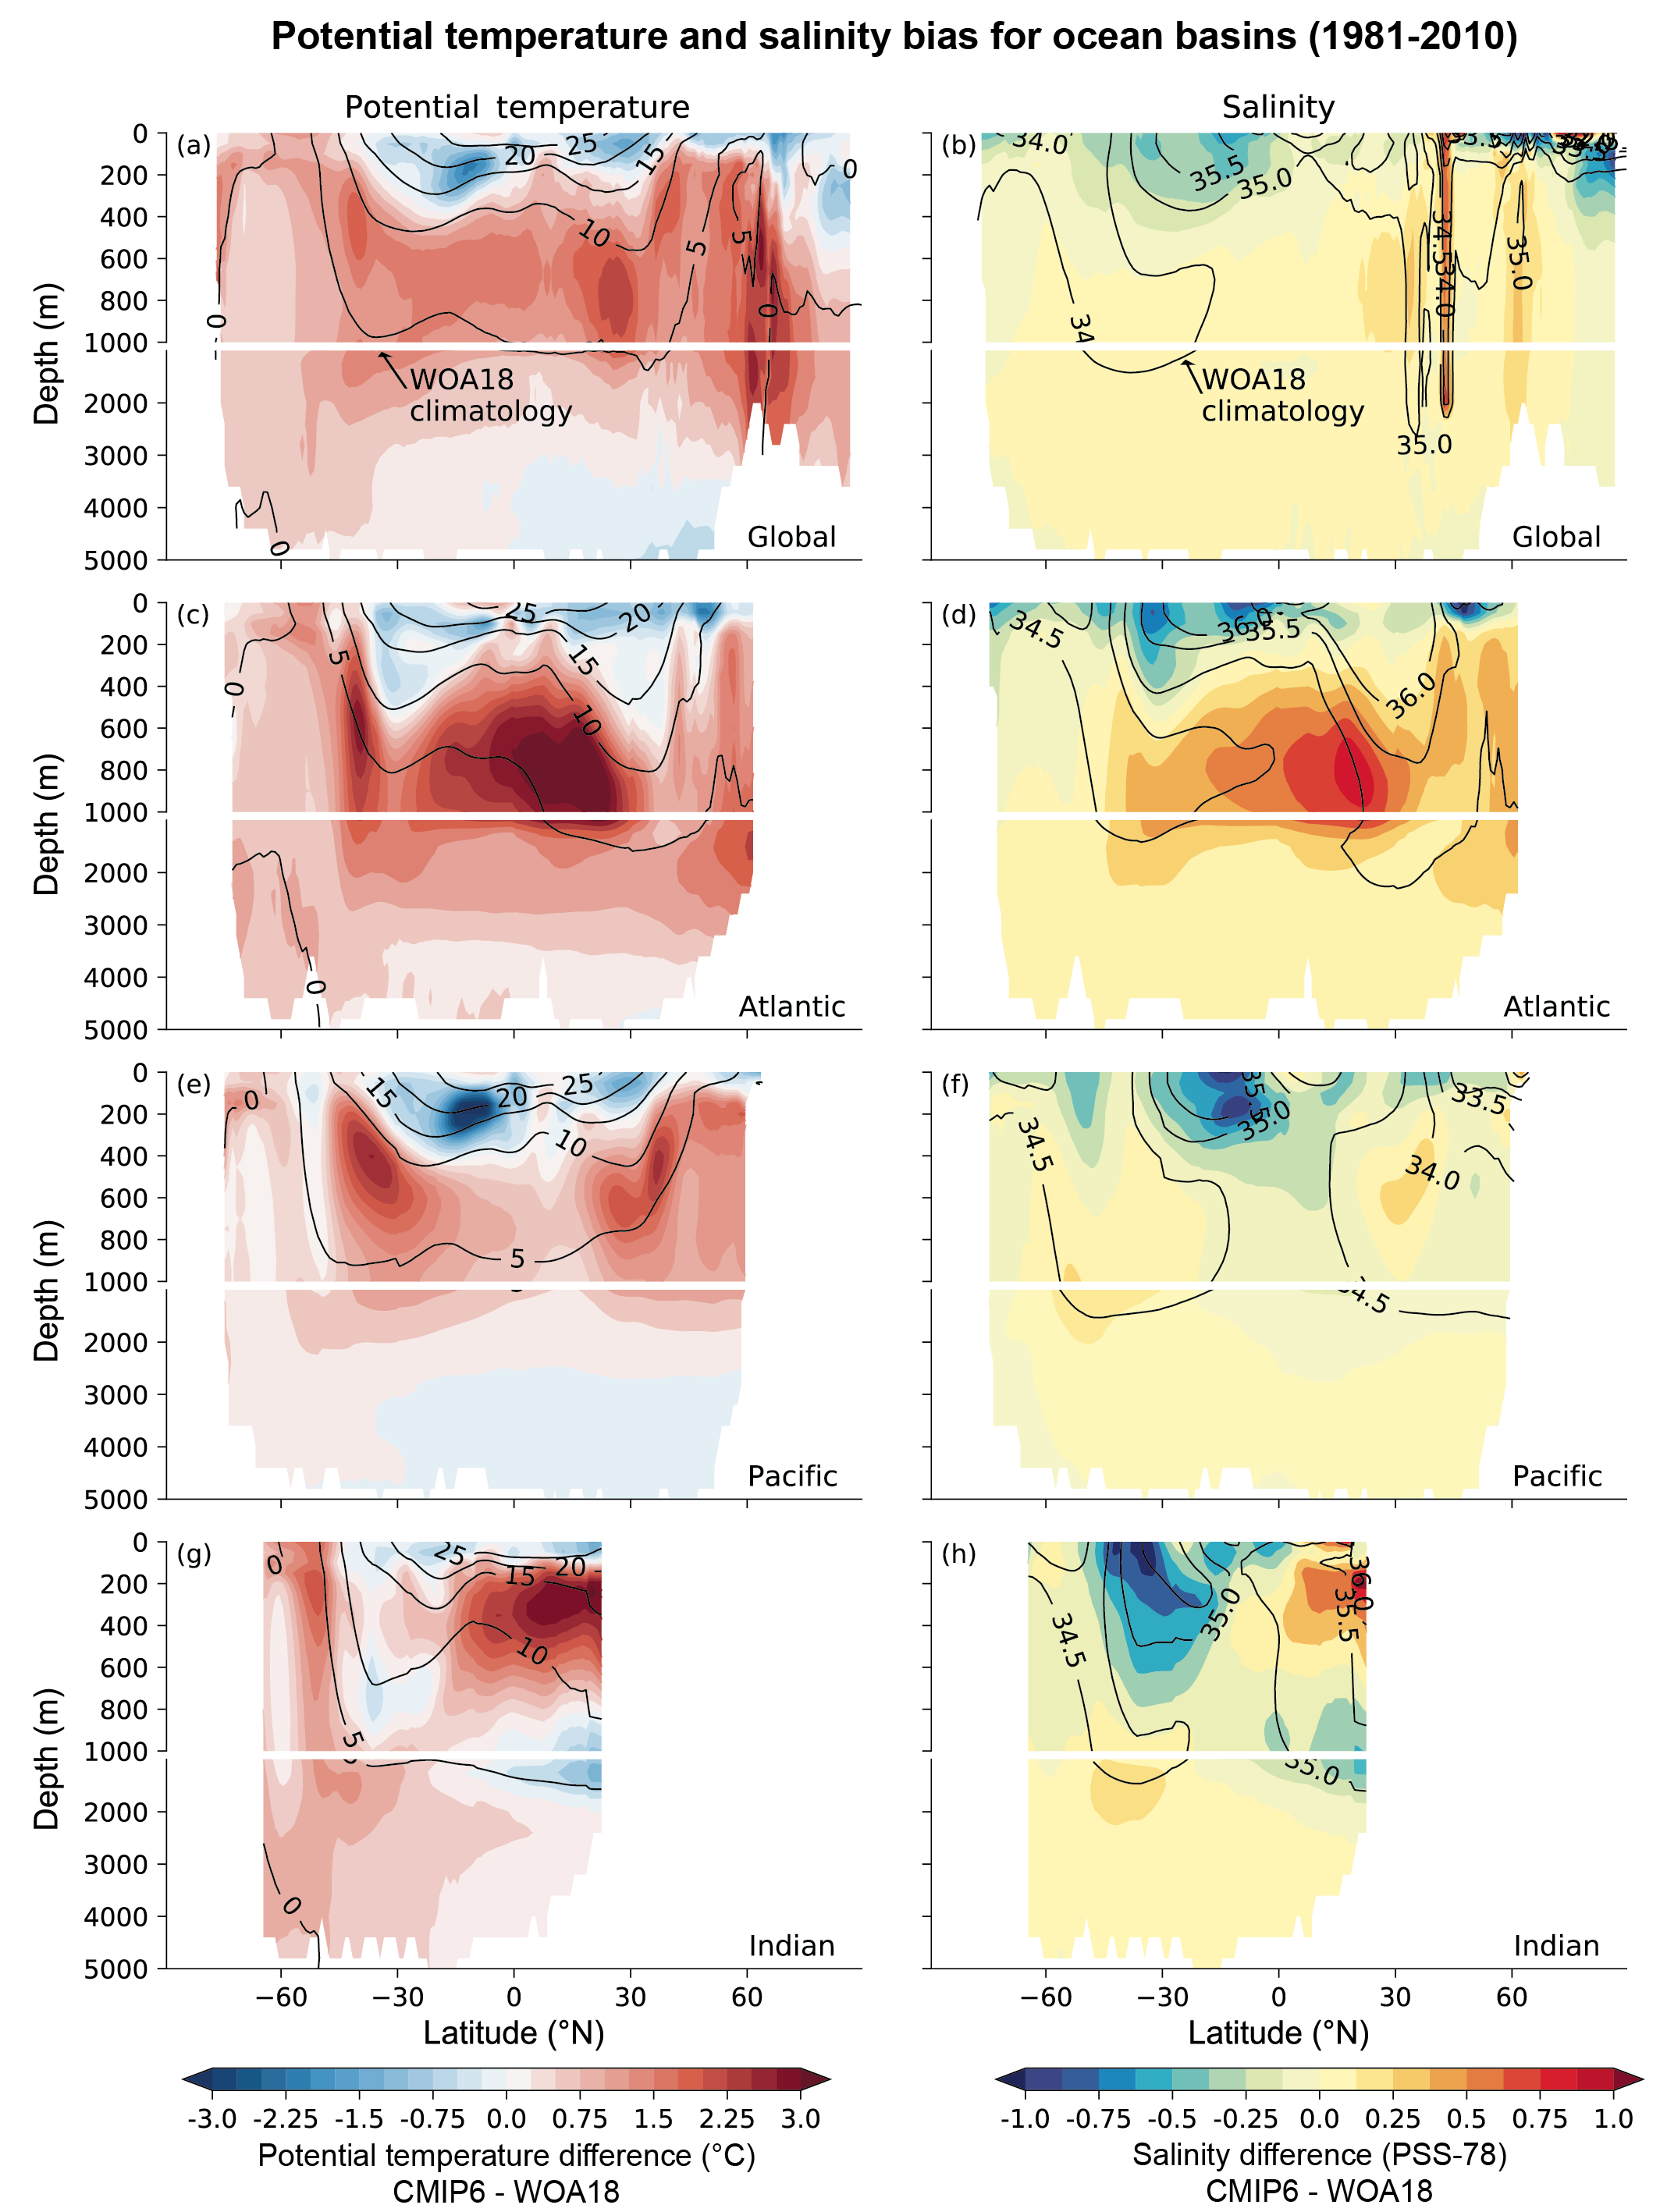
Figure caption
Figure 3.25 | CMIP6 potential temperature and salinity biases for the global ocean, Atlantic Ocean, Pacific Ocean and Indian Ocean. Shown in colour are the time-mean differences between the CMIP6 historical multi-model climatological mean and observations, zonally averaged for each basin (excluding marginal and regional seas). The observed climatological values are obtained from the World Ocean Atlas 2018 (WOA18, 1981–2010; Prepared by the Ocean Climate Laboratory, National Oceanographic Data Center, Silver Spring, MD, USA), and are shown as labelled black contours for each of the basins. The simulated annual mean climatologies for 1981 to 2010 are calculated from available CMIP6 historical simulations, and the WOA18 climatology utilized synthesized observed data from 1981 to 2010. Output from a total of 30 available CMIP6 models is used for the temperature panels (left column) and 28 models for the salinity panels (right column). Potential temperature units are °C and salinity units are the Practical Salinity Scale 1978 [PSS-78]. Further details on data sources and processing are available in the chapter data table (Table 3.SM.1).