Back chapter figures
Figure 3.26
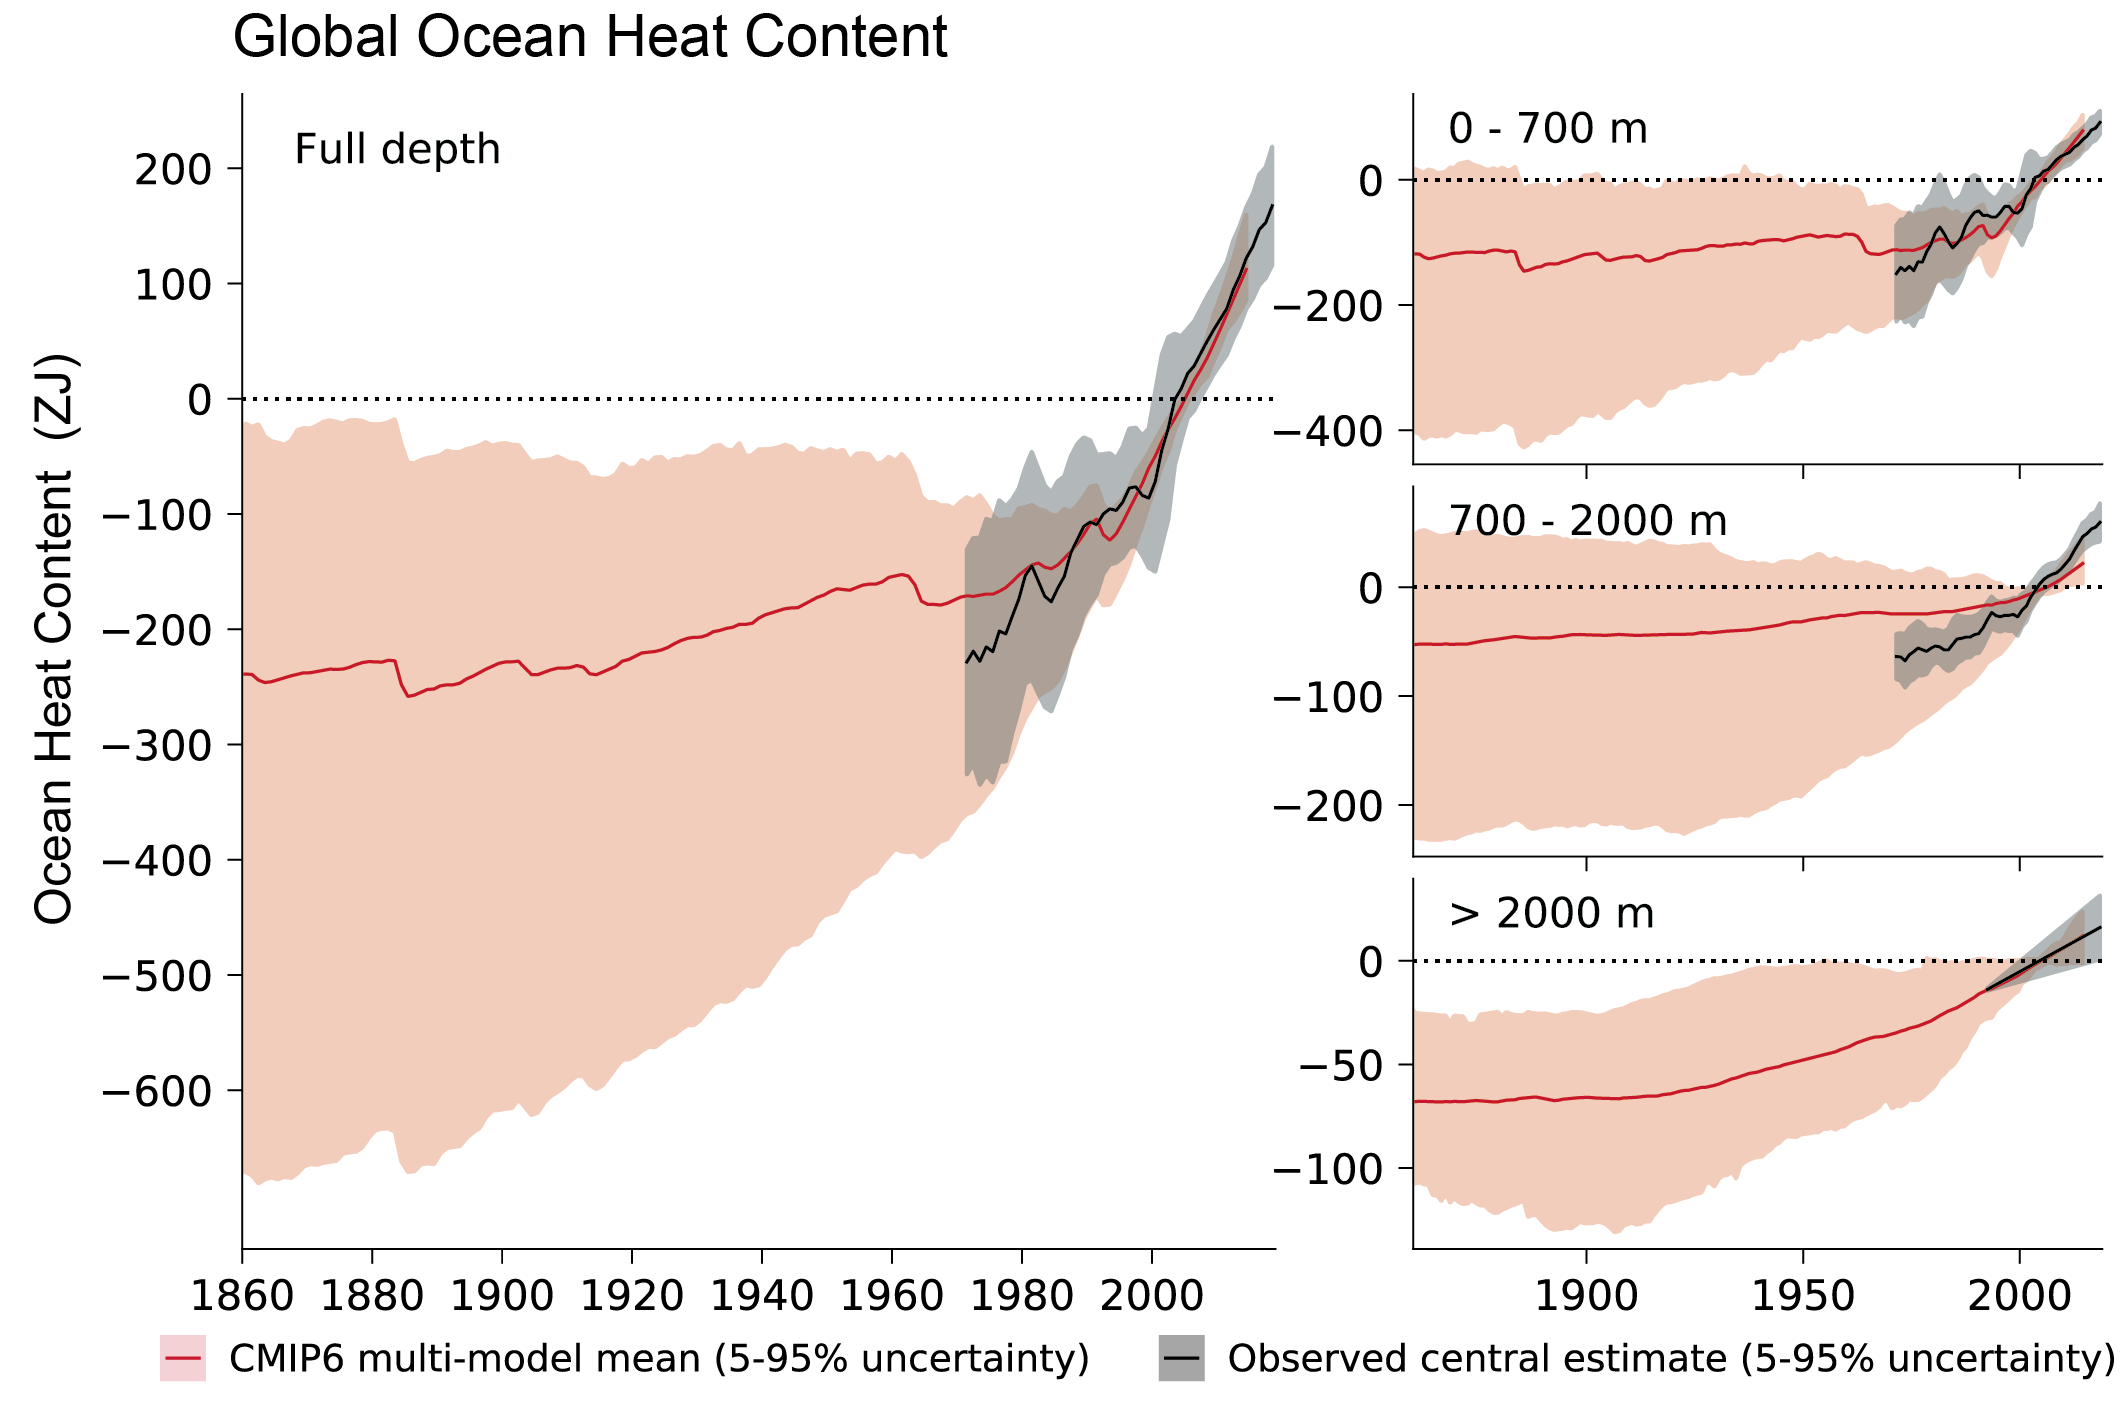
Figure caption
Figure 3.26 | Global ocean heat content in CMIP6 simulations and observations. Time series of observed (black) and simulated (red) global ocean heat content anomalies with respect to 1995–2014 for the full ocean depth (left-hand panel); upper layer: 0–700 m (top right-hand panel); intermediate layer: 700–2000 m (middle right-hand panel); and the abyssal ocean: >2000 m (bottom right-hand panel). The best estimate observations (black solid line) for the period of 1971–2018, along with very likely ranges (black shading) are from Section 2.3.3.1. For the models (1860–2014), ensemble members from 15 CMIP6 models are used to calculate the multi-model mean values (red solid line) after averaging across simulations for each independent model. The very likely ranges in the simulations are shown in red shading. Simulation drift has been removed from all CMIP6 historical runs using a contemporaneous portion of the linear fit to each corresponding pre-industrial control run (Gleckler et al., 2012). Units are zettajoules (ZJ; 1021 joule). Further details on data sources and processing are available in the chapter data table (Table 3.SM.1).