Back chapter figures
Figure 3.27
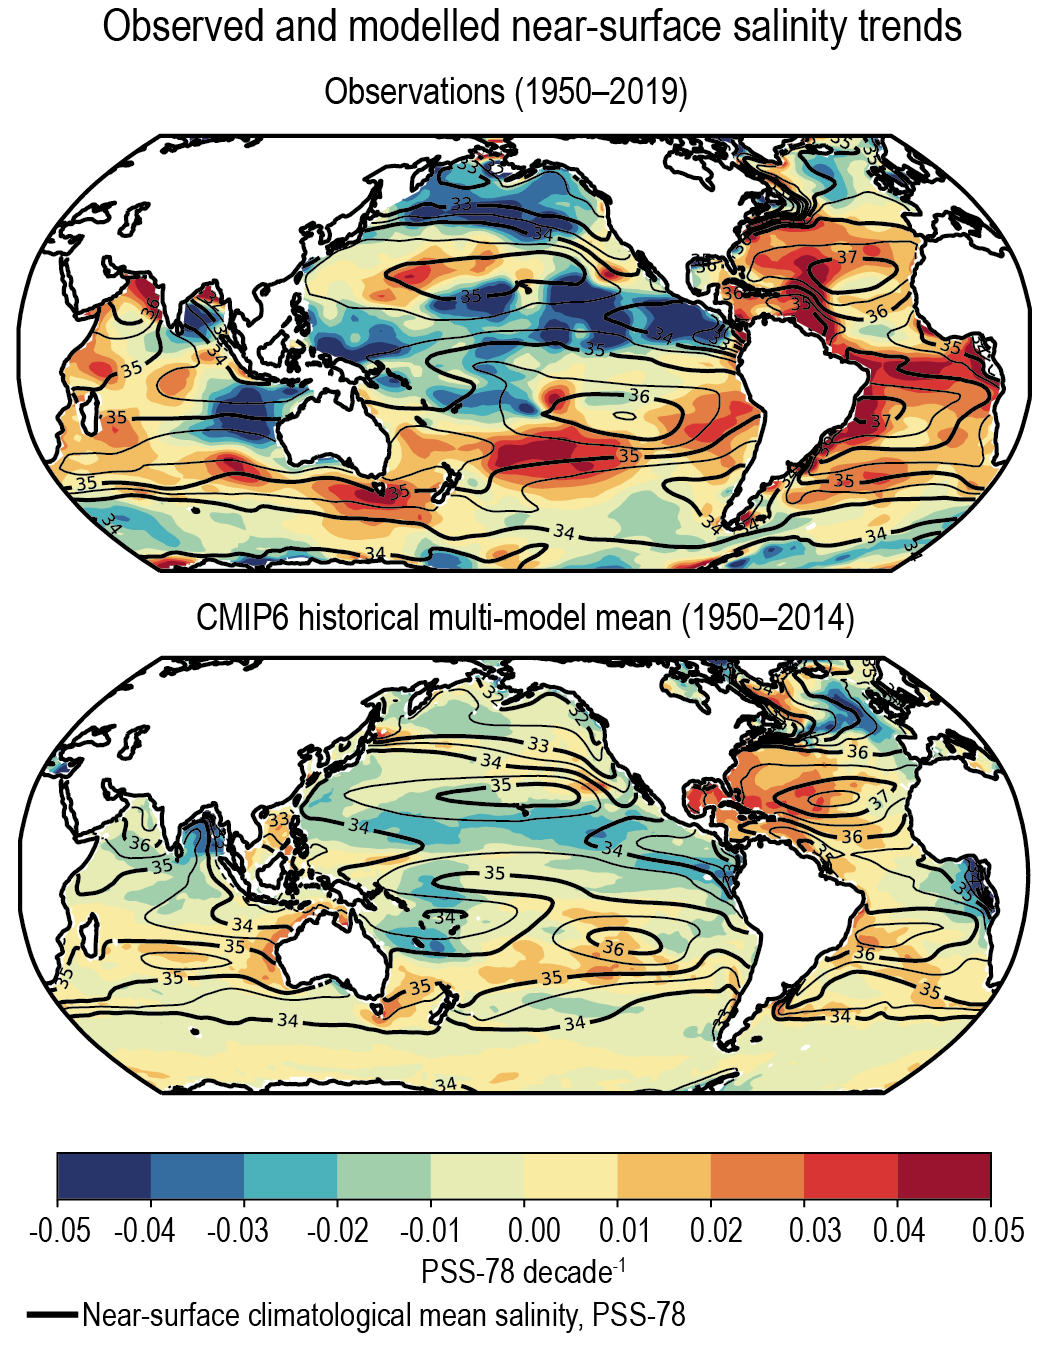
Figure caption
Figure 3.27 | Maps of multi-decadal salinity trends for the near-surfaceocean. Units are Practical Salinity Scale 1978 [PSS-78] per decade. (Top) The best estimate Section 2.3.3.2) observed trend (1950–2019, Durack and Wijffels, 2010). (Bottom) Simulated trend from the CMIP6 historical experiment multi-model mean (1950–2014). Black contours show the climatological mean salinity in increments of 0.5 PSS-78 (thick lines 1 PSS-78). Further details on data sources and processing are available in the chapter data table (Table 3.SM.1).