Back chapter figures
Figure 3.28
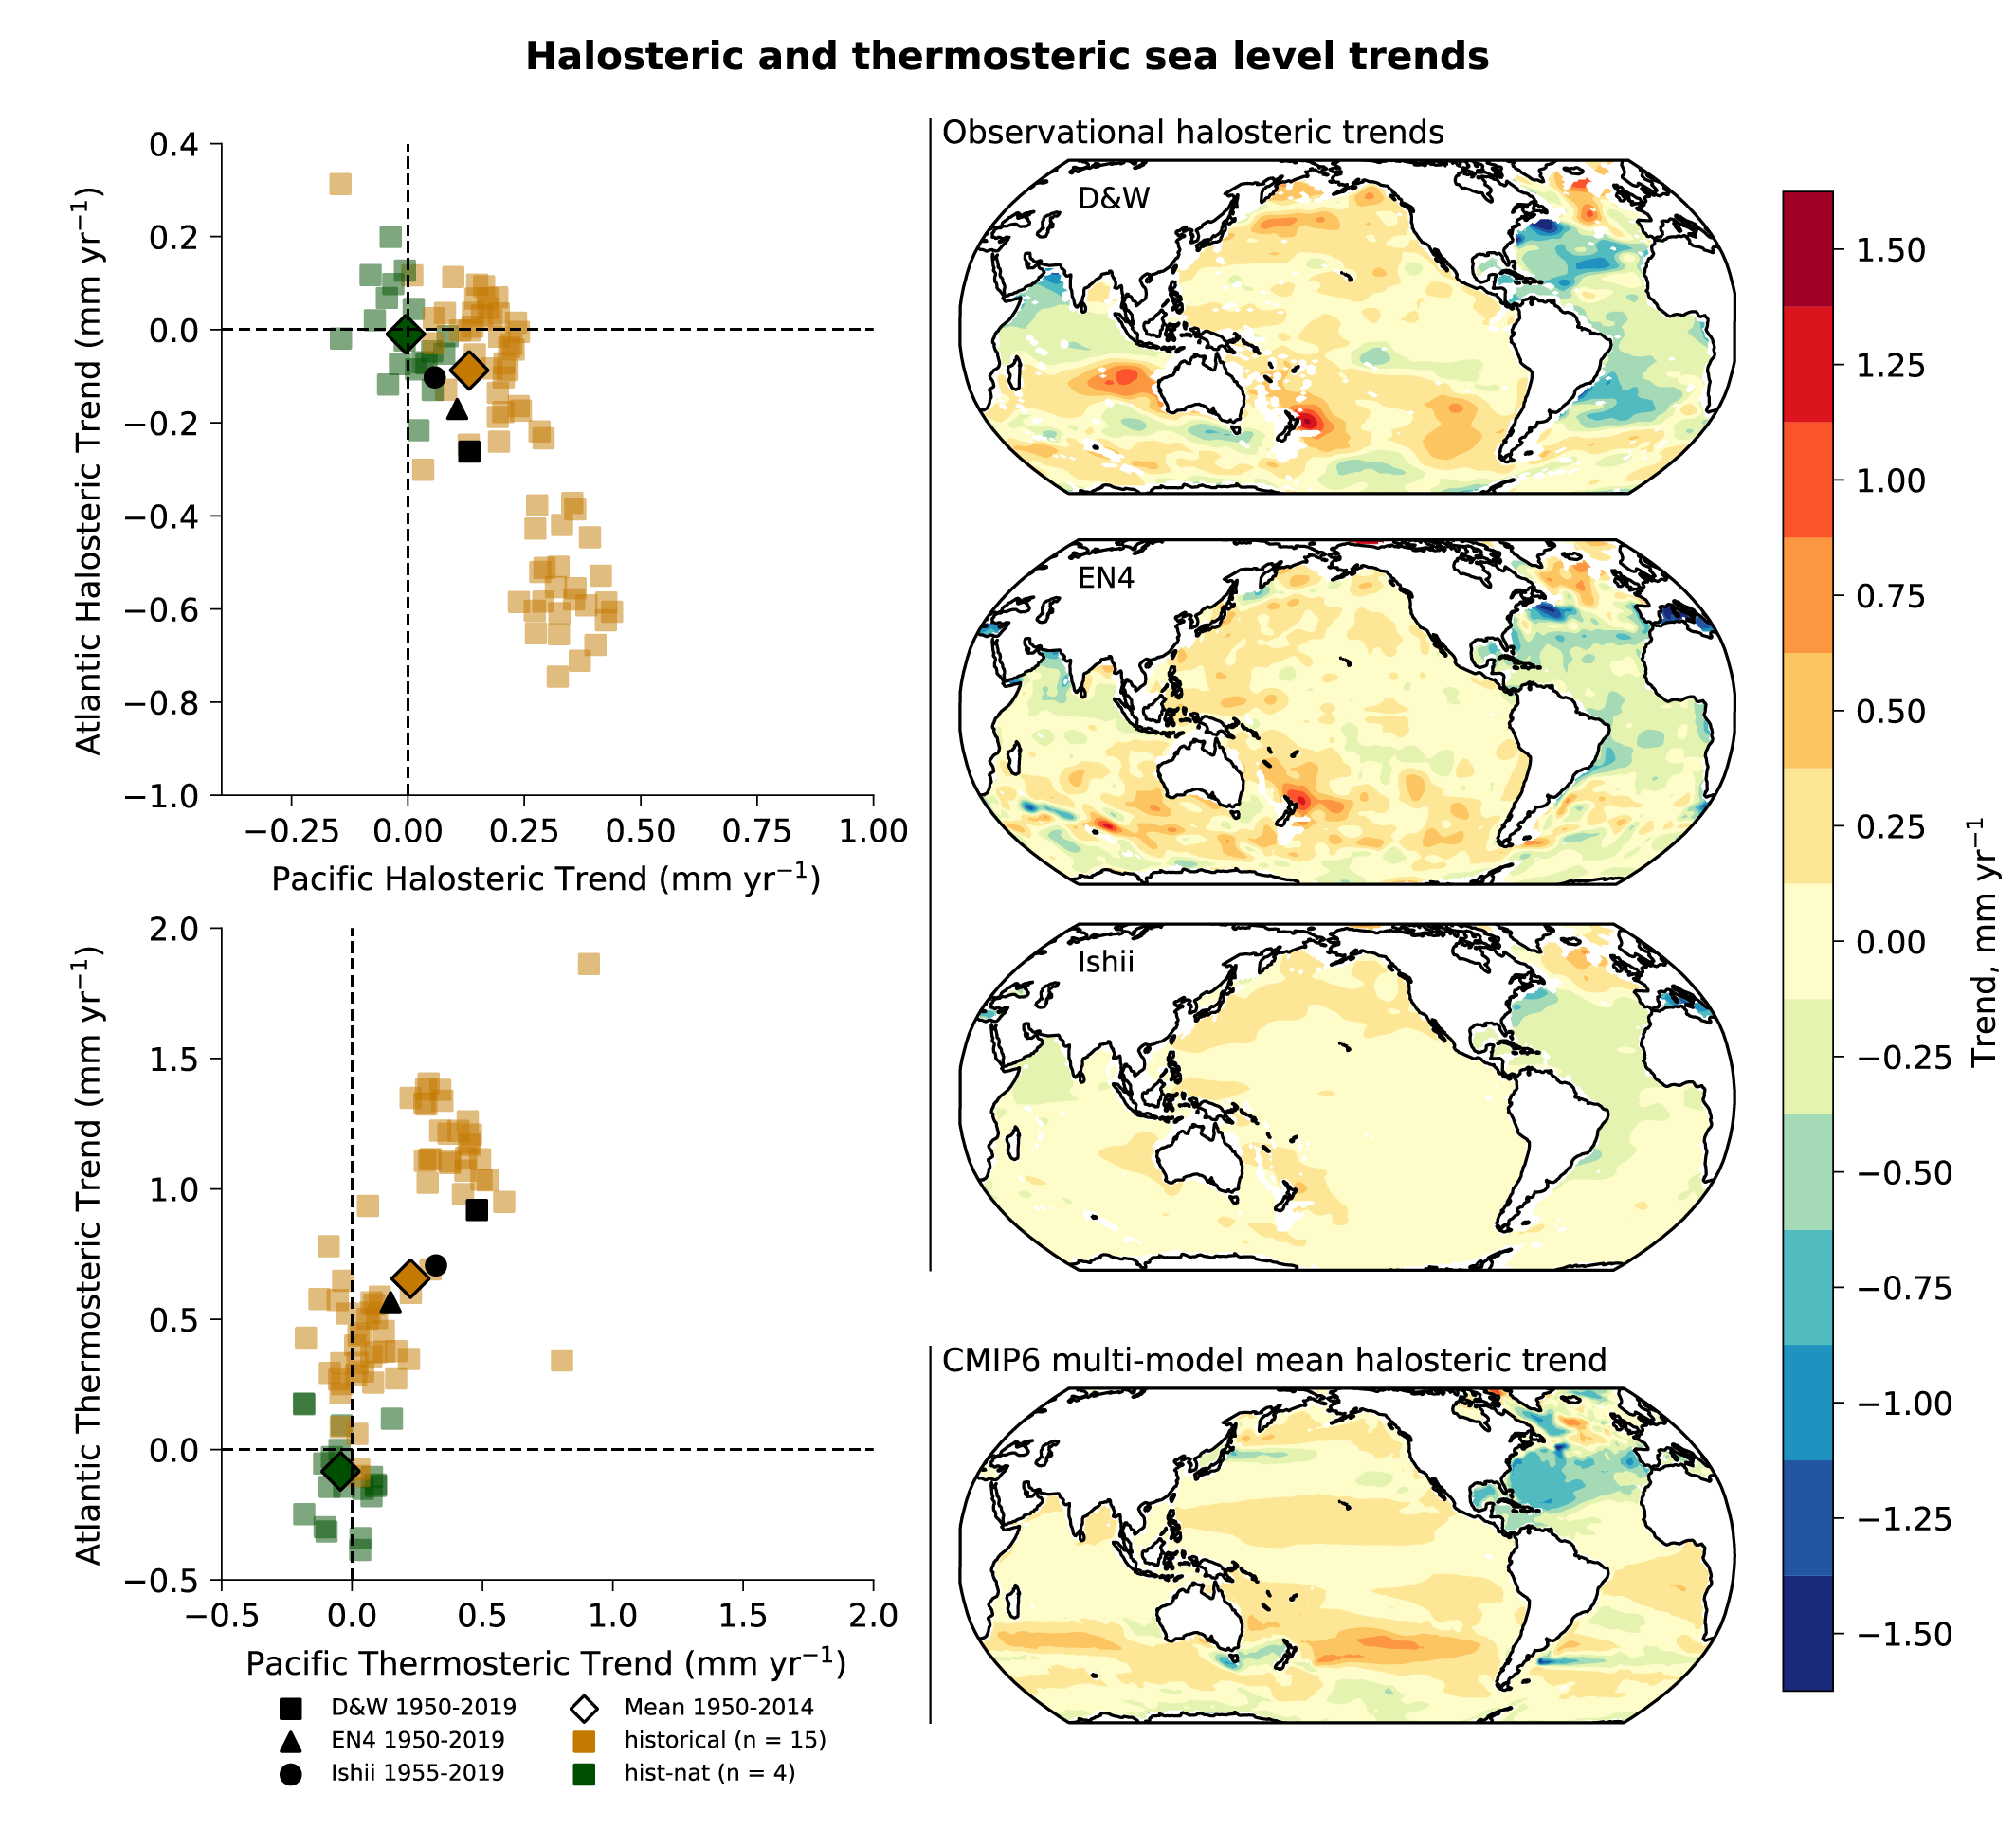
Figure caption
Figure 3.28 | Long-term trends in halosteric and thermosteric sea level in CMIP6 models and observations. Units are mm yr–1. In The right-hand column, three observed maps of 0 to 2000 m halosteric sea level trends are shown: top (D&W) from Durack and Wijffels (2010), 1950–2019, updated; upper-middle (EN4) from Good et al. (2013), 1950–2019, updated; and lower-middle (Ishii) from Ishii et al. (2017), 1955–2019, updated. Bottom-right: the CMIP6 historical multi-model mean (1950–2014). Red and orange colours show a halosteric contraction (enhanced salinity) and blue and green a halosteric expansion (reduced salinity). In The left-hand column , basin-integrated halosteric (top) and thermosteric (bottom) trends for the Atlantic and Pacific, the two largest ocean basins, are shown, where Pacific anomalies are presented on the x-axis and Atlantic on the y-axis. Observational estimates are presented in black, CMIP6 historical (all forcings) simulations are shown in orange squares, with the multi-model mean shown as a dark orange diamond with a black bounding box. CMIP6 hist-nat (historical natural forcings only) simulations are shown in green squares with the multi-model mean as a dark green diamond with a black bounding box. Further details on data sources and processing are available in the chapter data table (Table 3.SM.1).