Back chapter figures
Figure 3.29
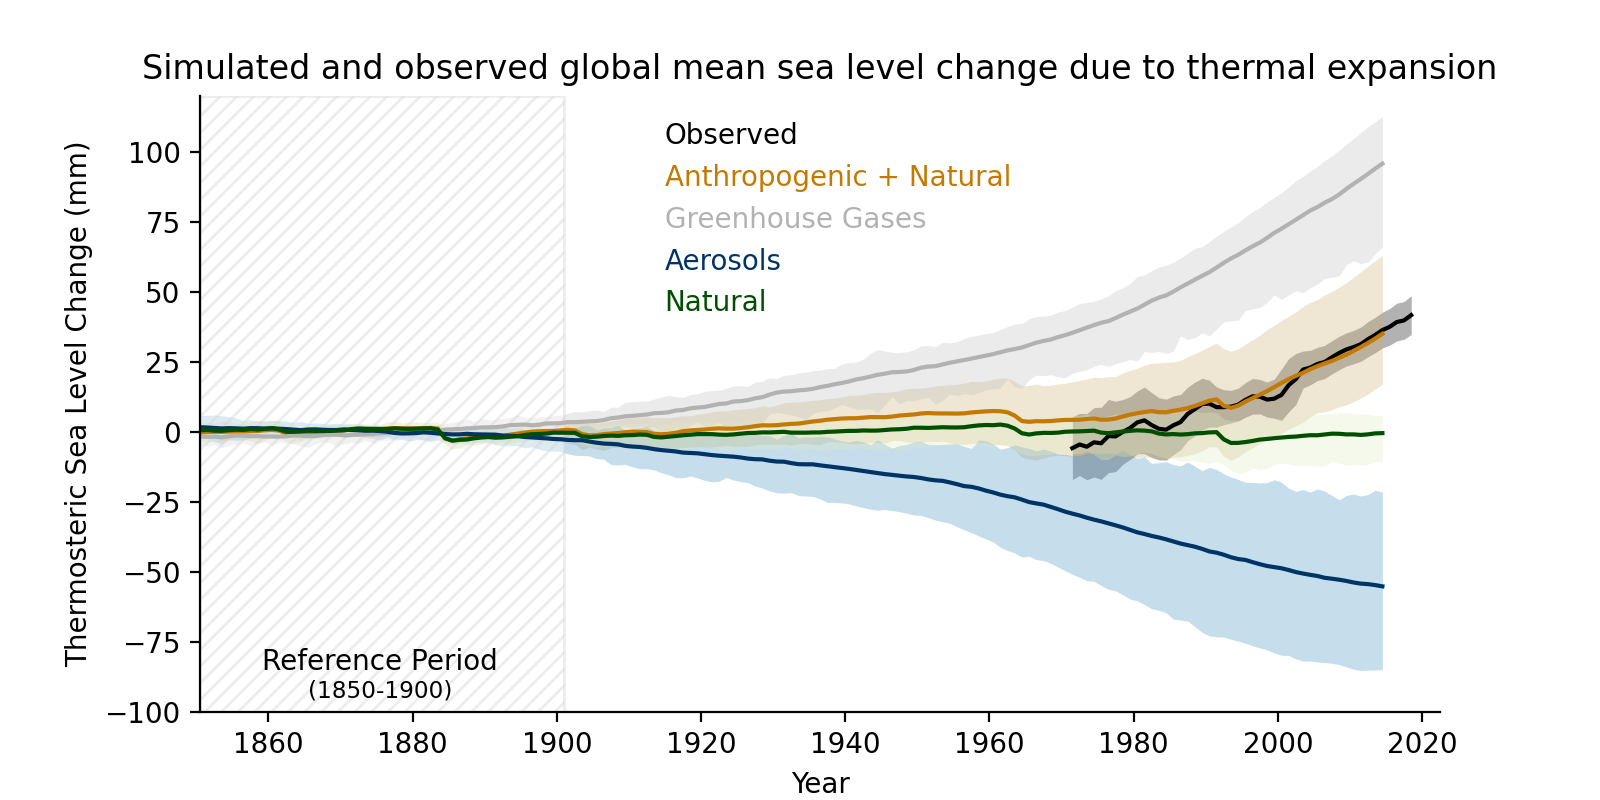
Figure caption
Figure 3.29 | Simulated and observed global mean sea level change due to thermal expansion for CMIP6 models and observations relative to the baseline period 1850–1900. Historical simulations are shown in brown, natural only in green, greenhouse gas only in grey, and aerosol only in blue (multi-model means shown as thick lines, and shaded ranges between the 5th and 95th percentile). The best estimate observations (black solid line) for the period of 1971–2018, along with very likely ranges (black shading) are from Section 2.3.3.1 and are shifted to match the multi-model mean of the historical simulations for the 1995–2014 period. Further details on data sources and processing are available in the chapter data table (Table 3.SM.1).