Back chapter figures
Figure 3.3
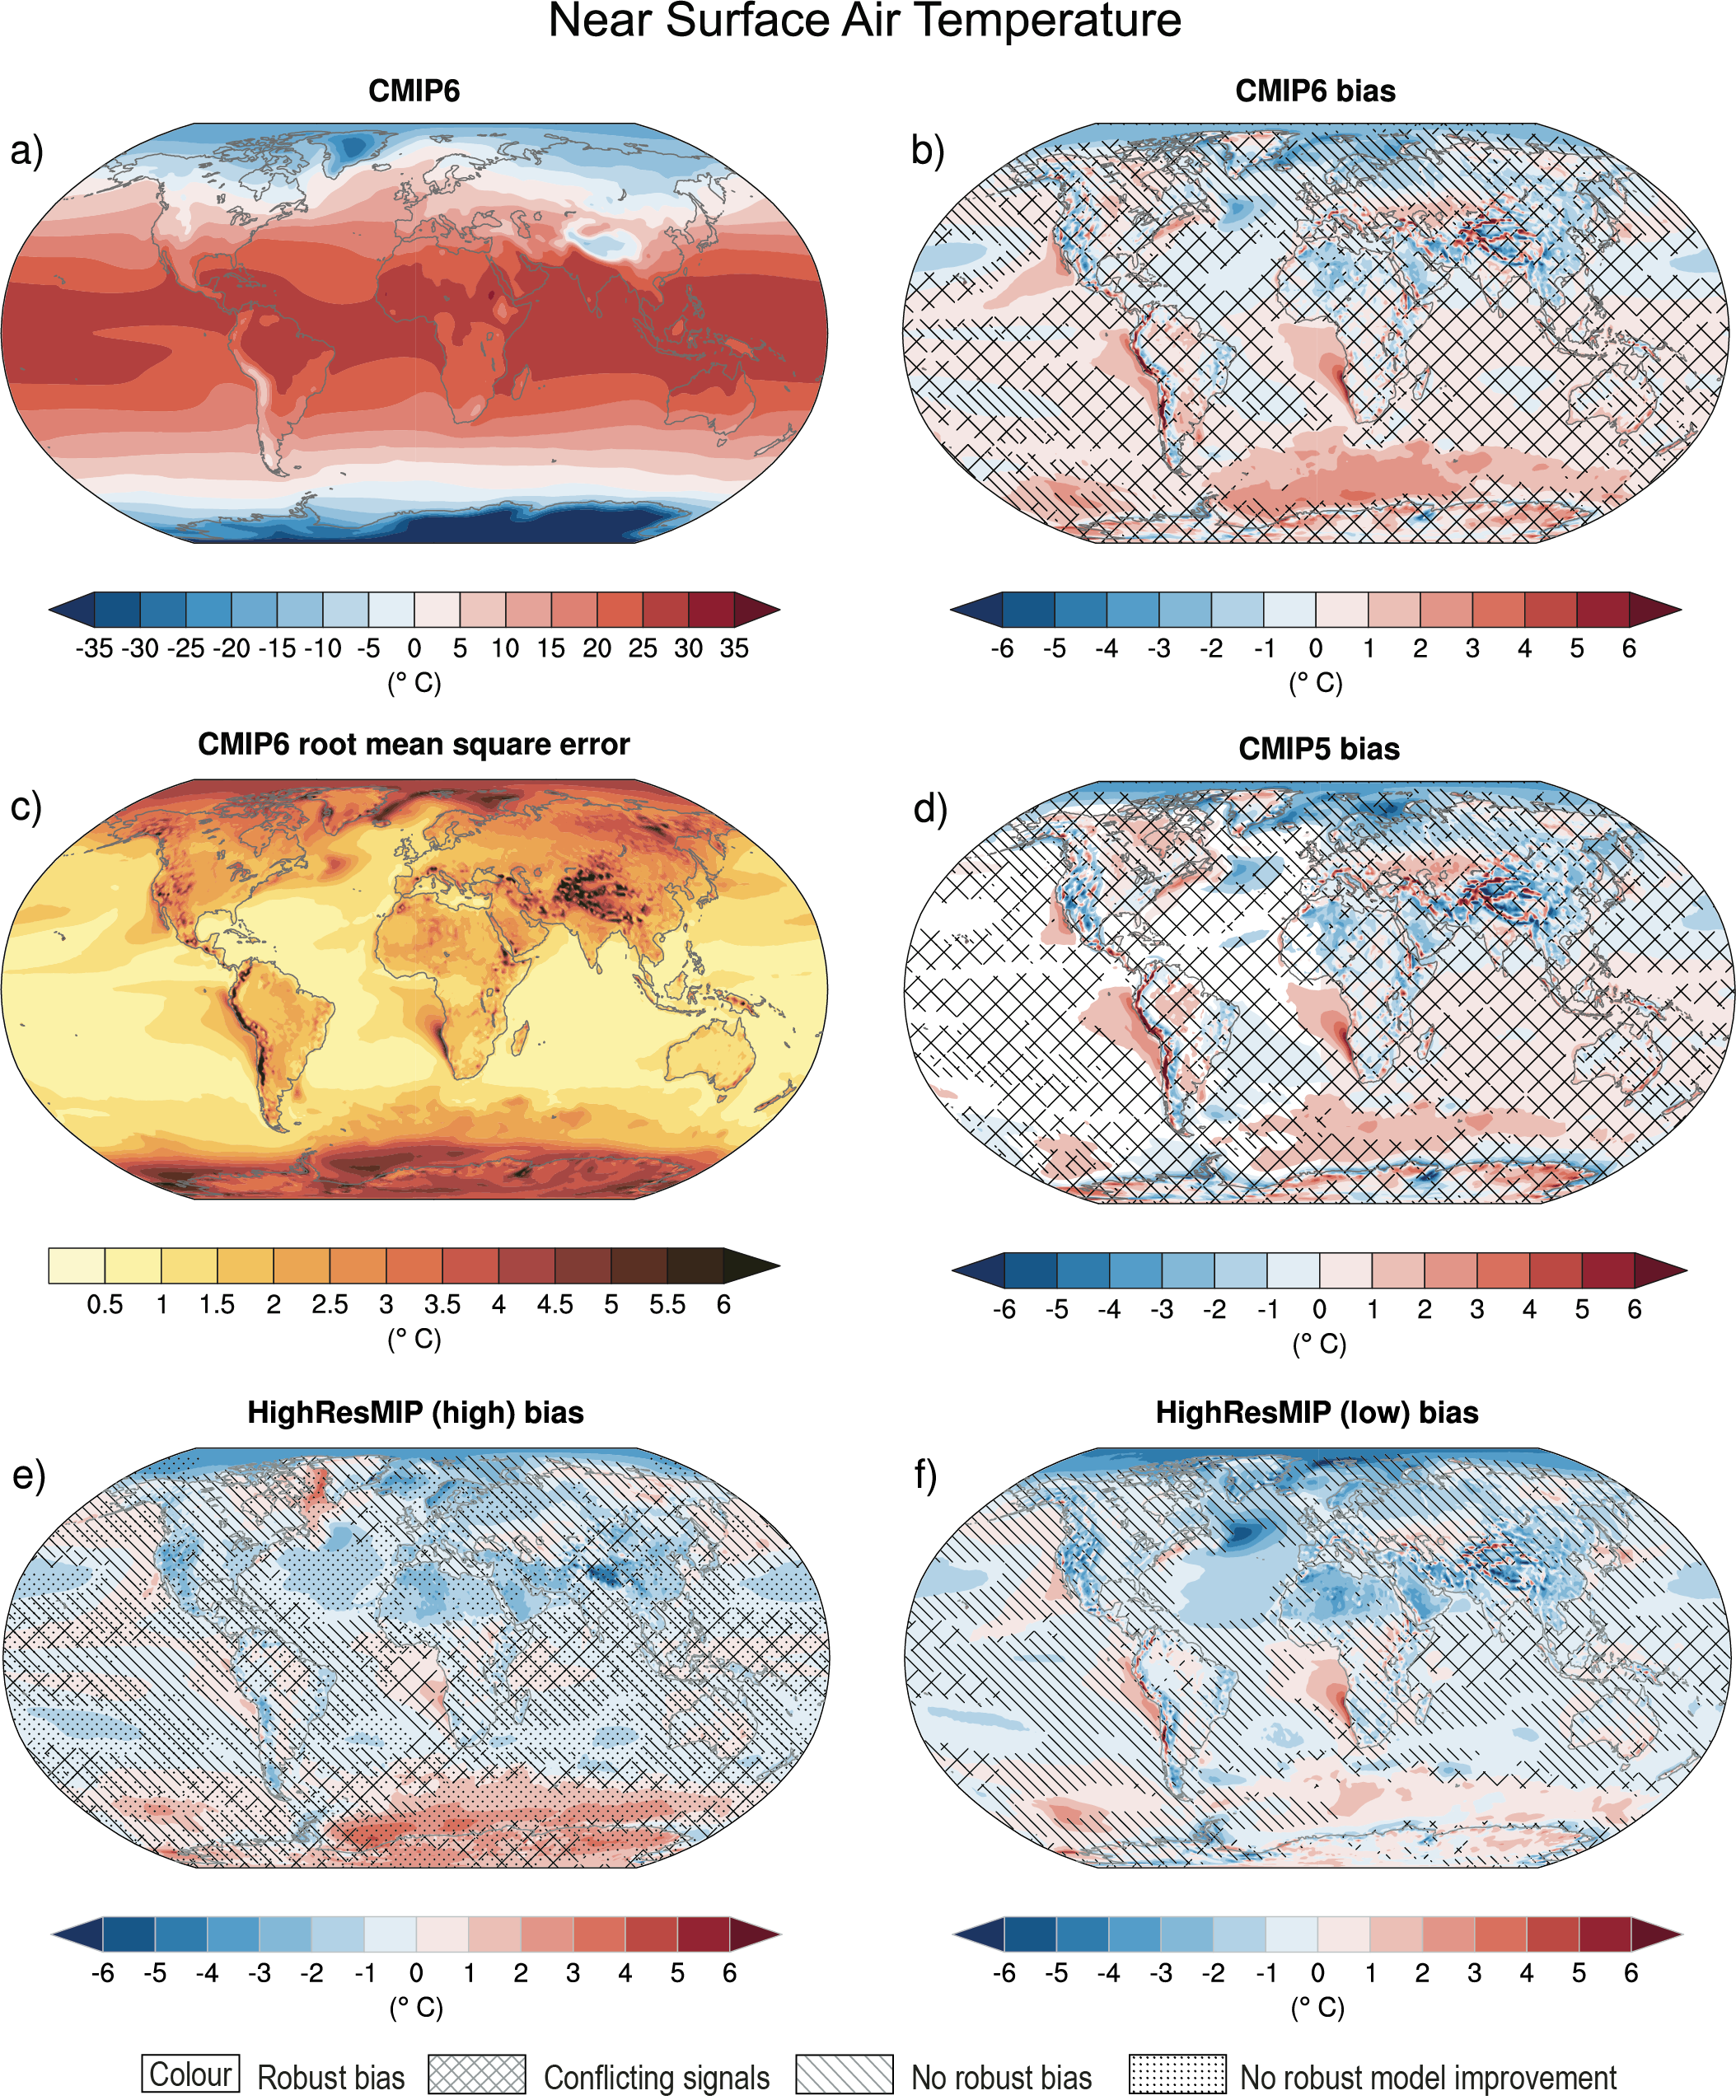
Figure caption
Figure 3.3 | Annual mean near-surface (2 m) air temperature (°C) for the period 1995–2014. (a) Multi-model (ensemble) mean constructed with one realization of the CMIP6 historical experiment from each model. (b) Multi-model mean bias, defined as the difference between the CMIP6 multi-model mean and the climatology of the fifth generation European Centre for Medium-Range Weather Forecasts (ECMWF) atmospheric reanalysis of the global climate (ERA5). (c) Multi-model mean of the root mean square error calculated over all months separately and averaged, with respect to the climatology from ERA5. (d) Multi-model mean bias defined as the difference between the CMIP6 multi-model mean and the climatology from ERA5. The difference between the multi-model mean of (e) high-resolution and (f) low-resolution simulations of four HighResMIP models and the climatology from ERA5 is also shown. Uncertainty is represented using the advanced approach: No overlay indicates regions with robust signal, where ≥66% of models show change greater than the variability threshold and ≥80% of all models agree on sign of change; diagonal lines indicate regions with no change or no robust signal, where <66% of models show a change greater than the variability threshold; crossed lines indicate regions with conflicting signal, where ≥66% of models show change greater than the variability threshold and <80% of all models agree on sign of change. For more information on the advanced approach, please refer to Cross-Chapter Box Atlas.1. Dots in panel (e) mark areas where the bias in high resolution versions of the HighResMIP models is not lower in at least three out of four models than in the corresponding low-resolution versions. Further details on data sources and processing are available in the chapter data table (Table 3.SM.1).