Back chapter figures
Figure 3.30
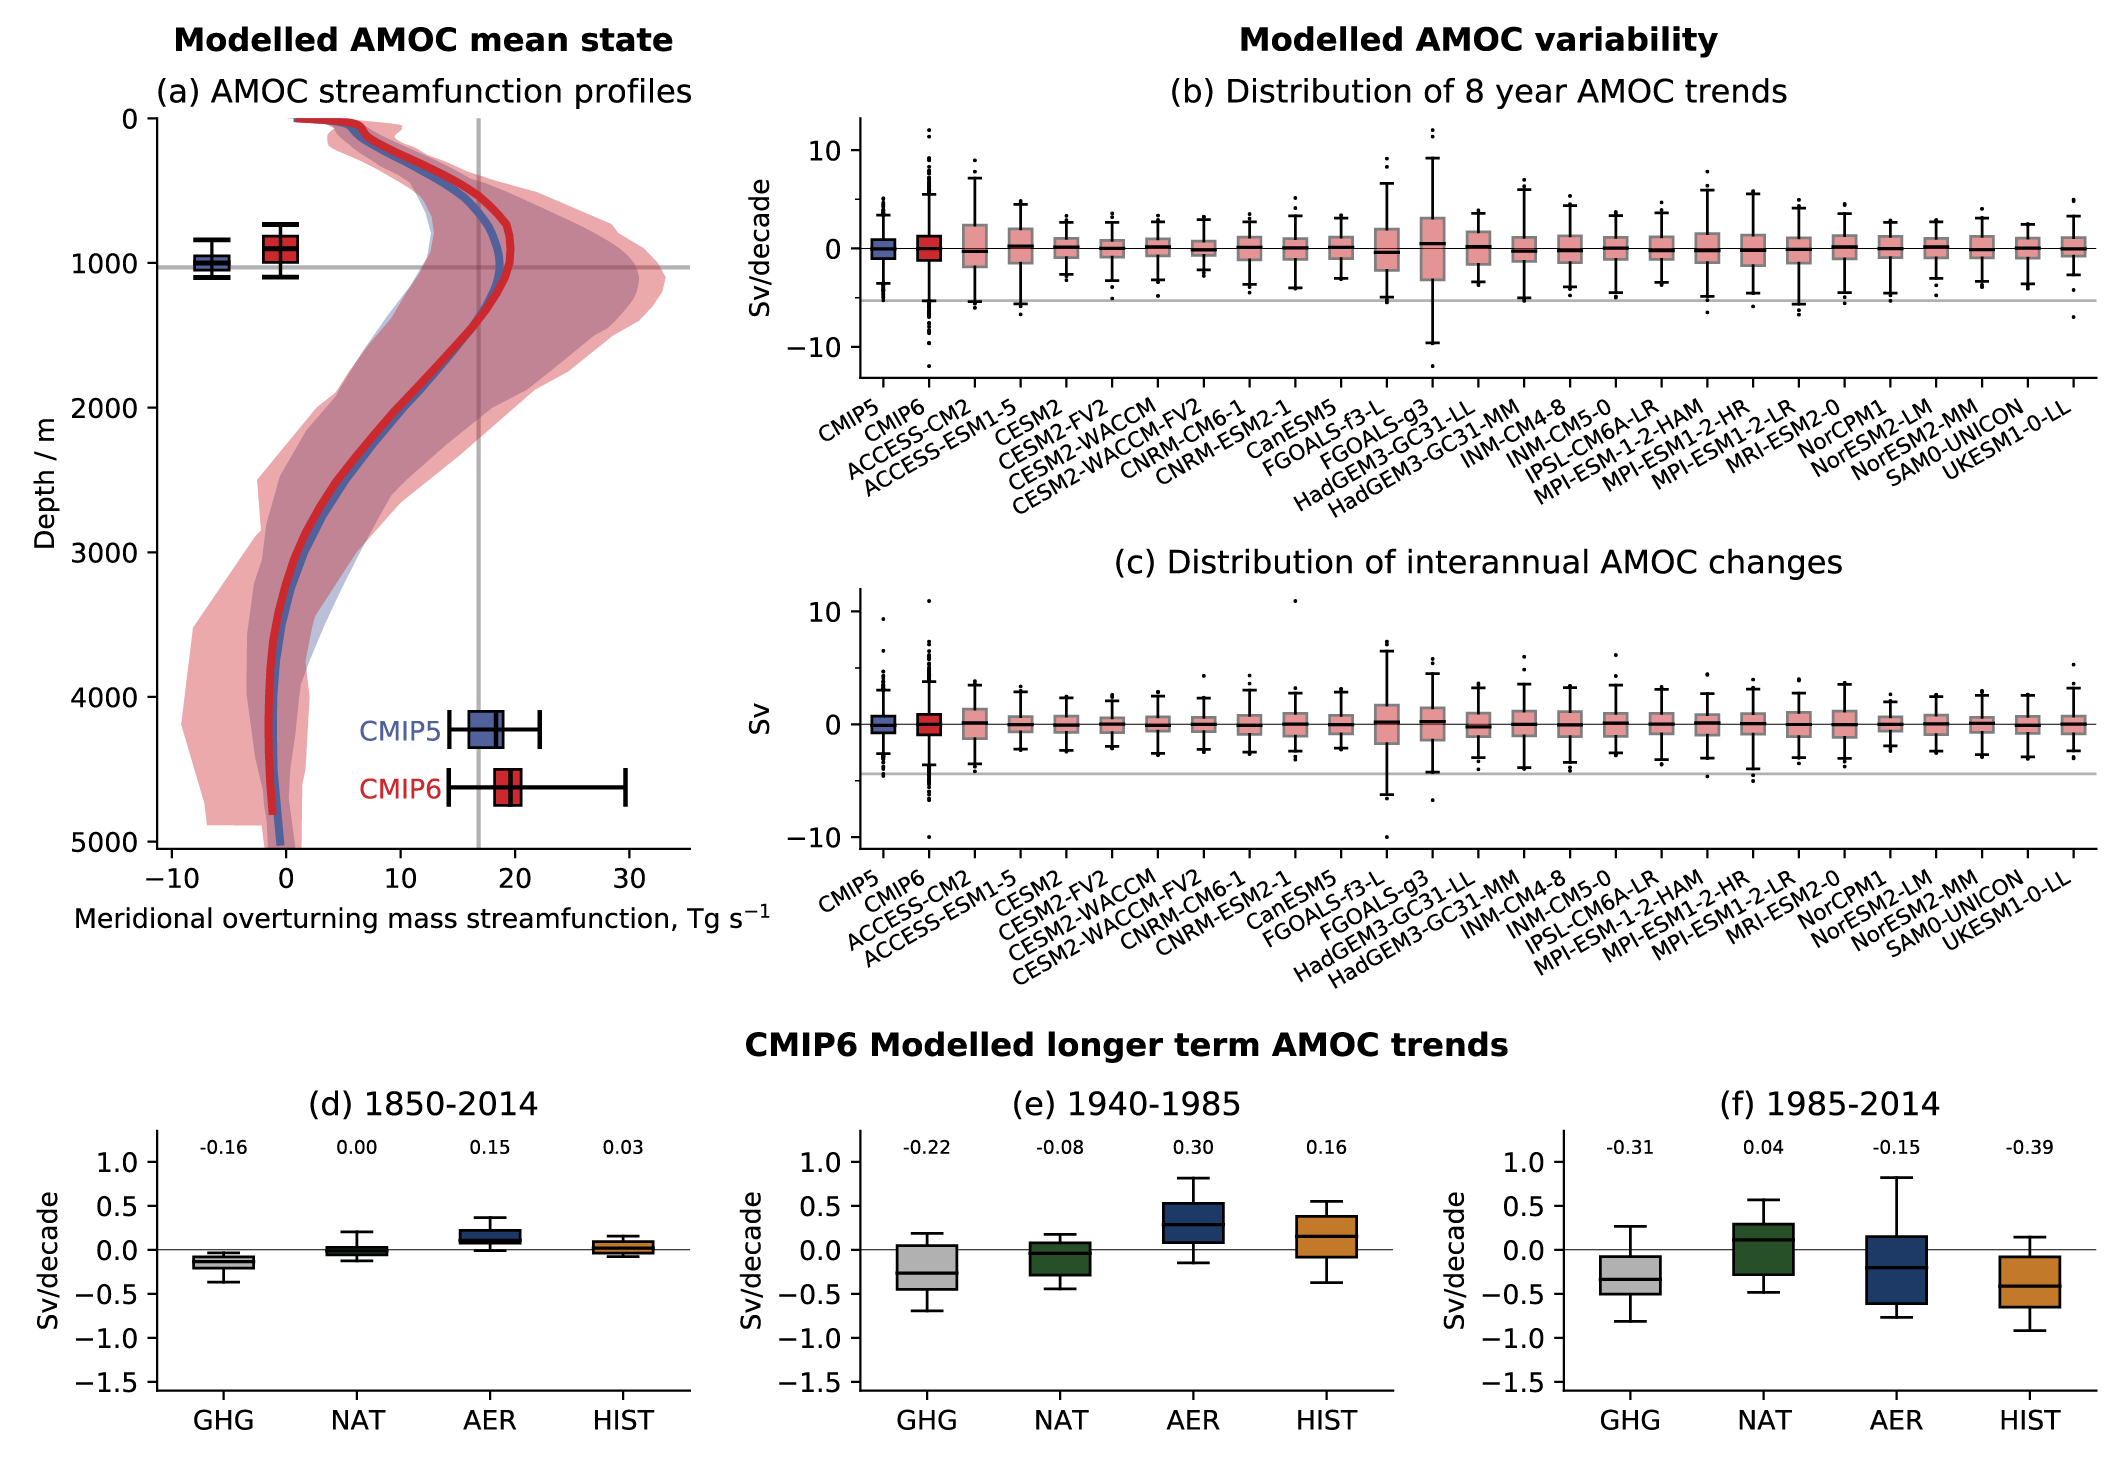
Figure caption
Figure 3.30 | Observed and CMIP6 simulated AMOC mean state, variability and long-term trends. (a) AMOC meridional stream function profiles at 26.5°N from the historical CMIP5 (1860–2004) and CMIP6 (1860–2014) simulations compared with the mean maximum overturning depth (horizontal grey line) and magnitude (vertical grey line) from the RAPID observations (2004–2018). The distributions of model ranges of AMOC maximum magnitude and depth are respectively displayed near the x- and y-axis. (b) Distributions of overlapping eight-year AMOC trends from individual CMIP6 historical simulations (pink box plots) are plotted along with the combined distributions of all available CMIP5 (blue boxplot) and CMIP6 (red boxplot) models. For reference, the observed eight-year trend calculated between 2004 and 2012 is also shown as a horizontal grey line (following Roberts et al., 2014). (c) Distributions of interannual AMOC variability from individual CMIP6 model historical simulations, along with the combined distributions of all available CMIP5 and CMIP6 models. Interannual variability in models and observations is estimated as annual mean (April–March) differences, and the horizontal grey line is the observed value for 2009/2010 minus 2008/2009 (following Roberts et al., 2014). (d–f) Distributions of linear AMOC trends calculated over various time periods (see panel titles) in CMIP6 simulations forced with: greenhouse gas forcing only (GHG), natural forcing only (NAT), anthropogenic aerosol forcing only (AER) and all forcing combined (Historical; HIST). (a–f) Boxes indicate the 25th to 75th percentile range, whiskers indicate 1st and 99th percentilesin (a-c) and 5th and 95th percentile in (d-f), and dots indicate outliers, while the horizontal black line is the multi-model mean trend. In (d–f) the multi-model mean trend is also written above each distribution. The multi-model distributions in (a–c) were produced with one historical ensemble member per model for which the AMOC variable was available (listed), while those in (d–f) were produced with the detection and attribution simulation datasets utilized by Menary et al. (2020). Further details on data sources and processing are available in the chapter data table (Table 3.SM.1).