Back chapter figures
Figure 3.31
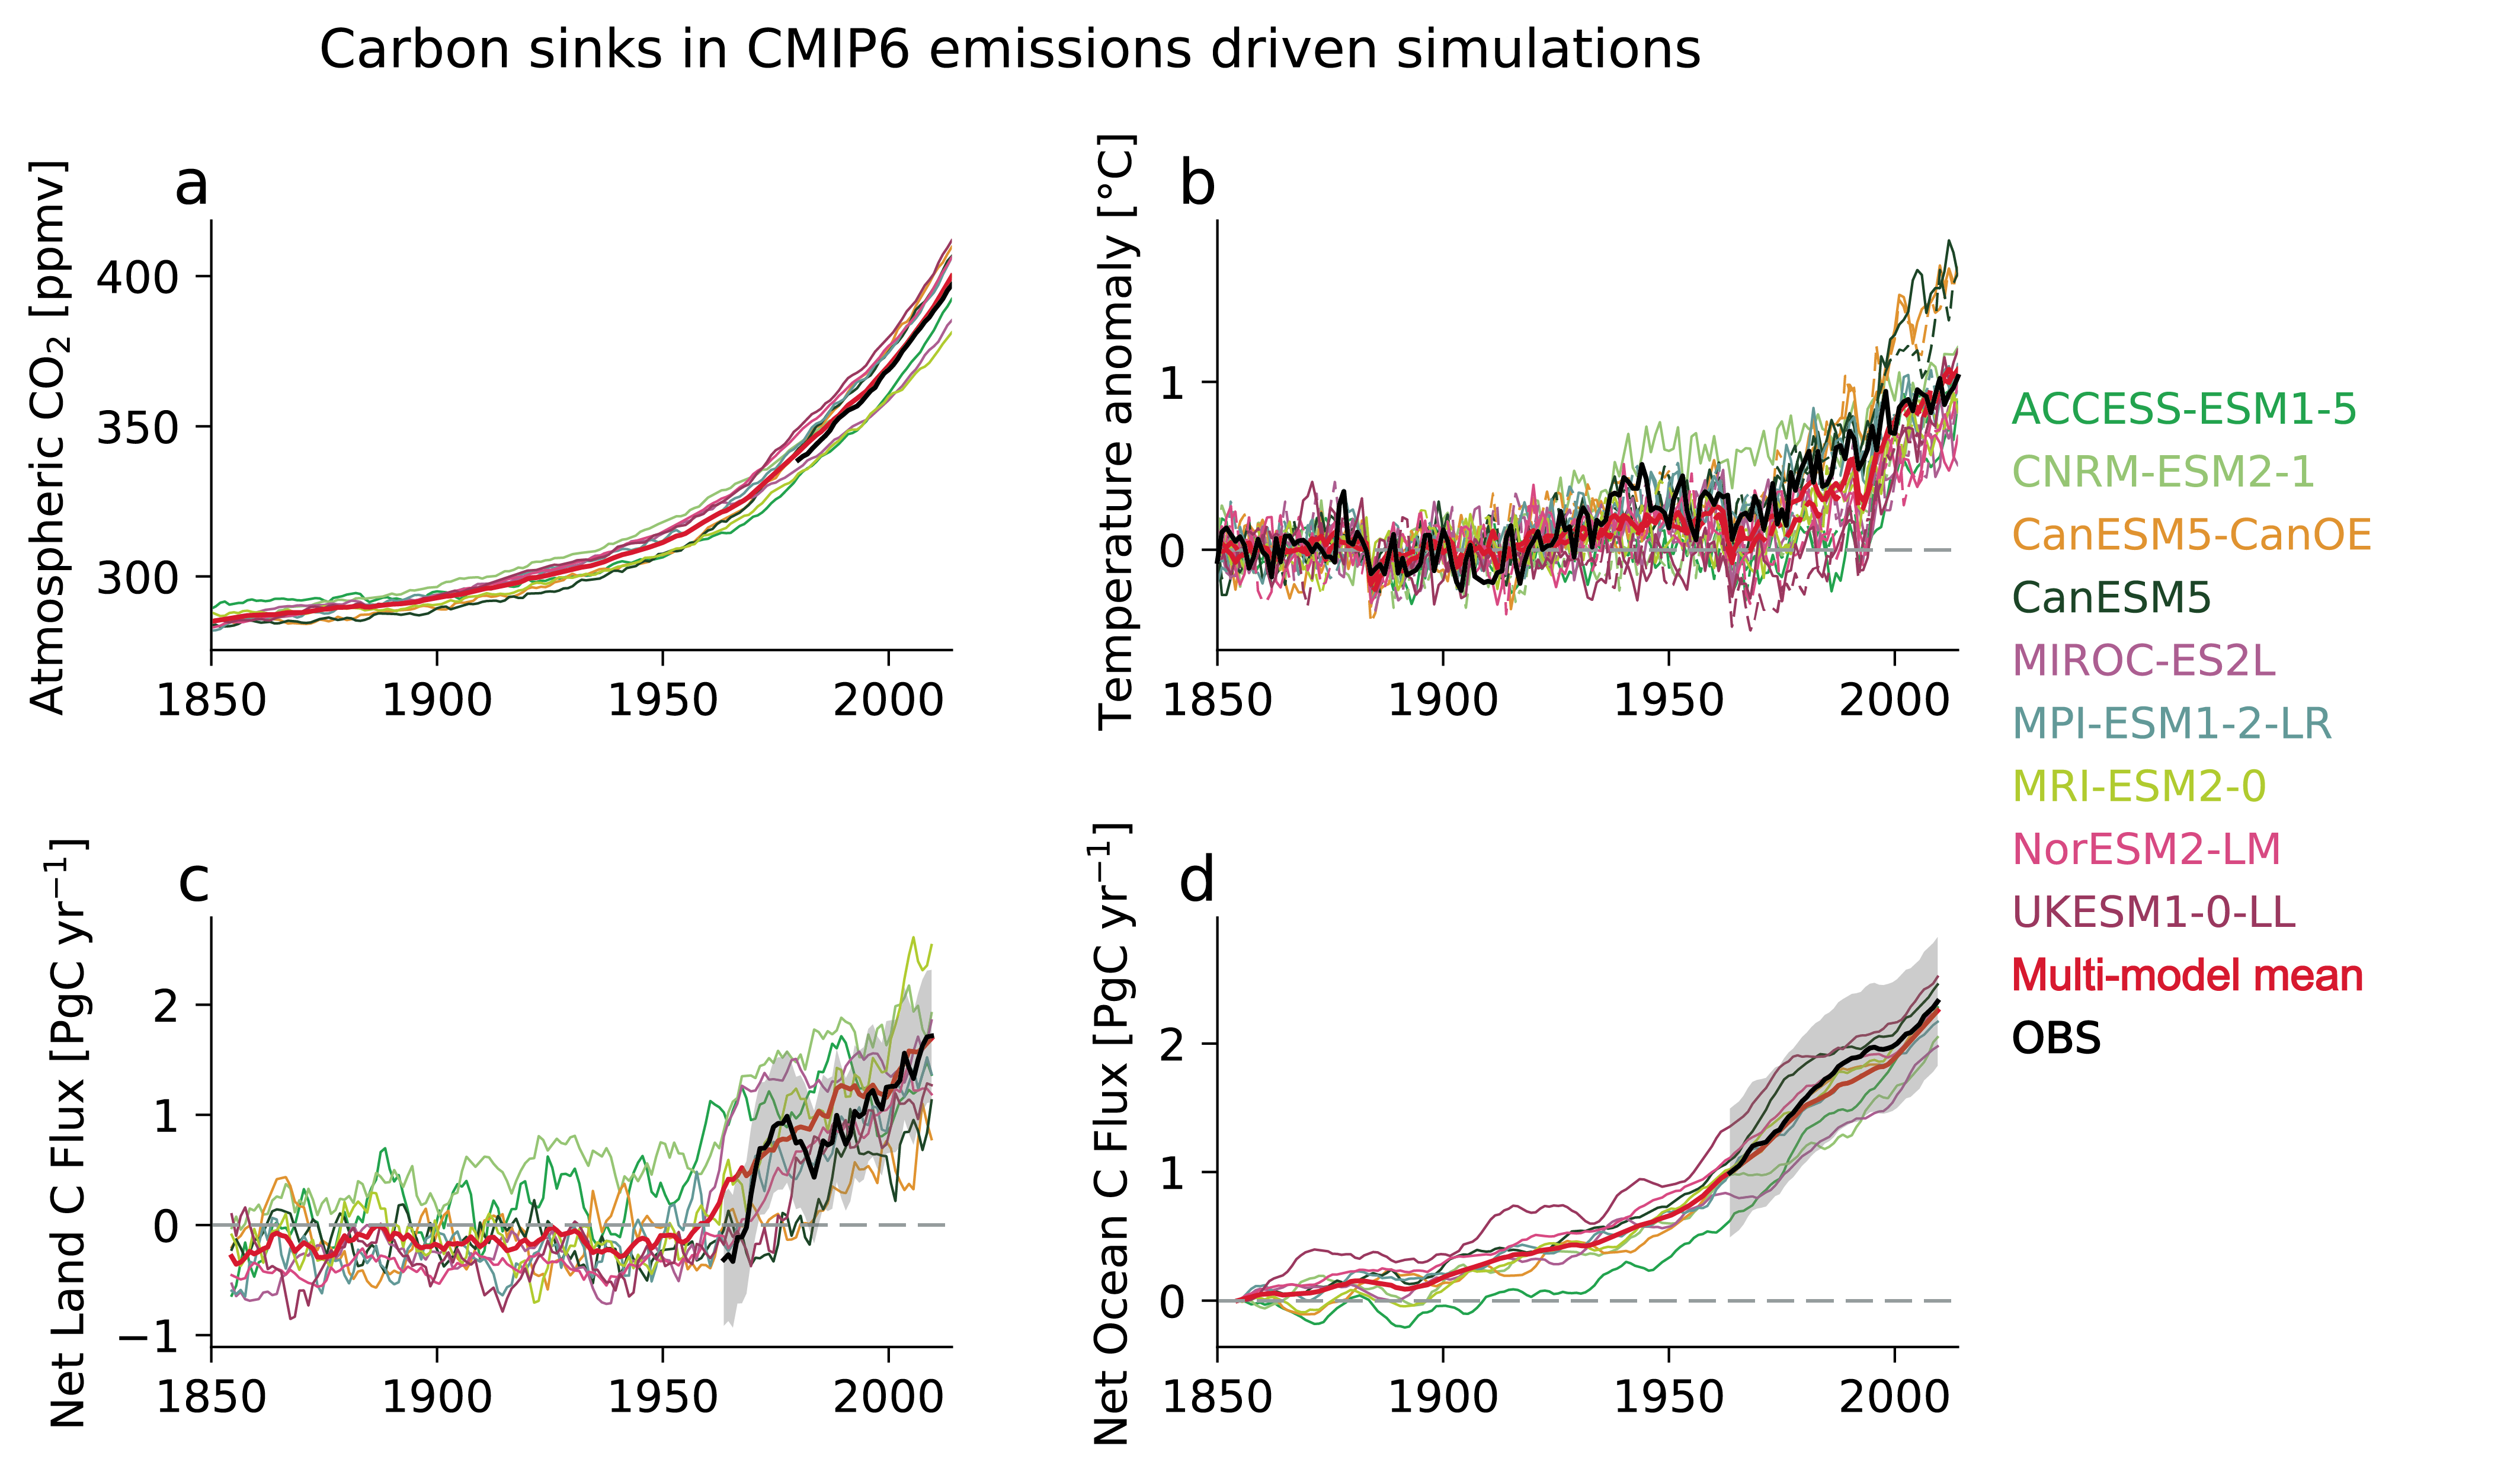
Figure caption
Figure 3.31 | Evaluation of historical emissions-driven CMIP6 simulations for 1850–2014. Observations (black) are compared to simulations of global mean (a) atmospheric CO2 concentration (ppmv), with observations from the National Oceanic and Atmospheric Administration Earth System Research Laboratory (NOAA ESRL; Dlugokencky and Tans, 2020); (b) surface air temperature anomaly (°C) with respect to the 1850–1900 mean, with observations from HadCRUT4 (Morice et al., 2012); (c) land carbon uptake (PgC yr–1), (d) ocean carbon uptake (PgC yr–1), both with observations from the Global Carbon Project (GCP; Friedlingstein et al., 2019) and grey shading indicating the observational uncertainty. Land and ocean carbon uptakes are plotted using a 10-year running mean for better visibility. The ocean uptake is offset to 0 in 1850 to correct for pre-industrial riverine-induced carbon fluxes. Further details on data sources and processing are available in the chapter data table (Table 3.SM.1).