Back chapter figures
Figure 3.32
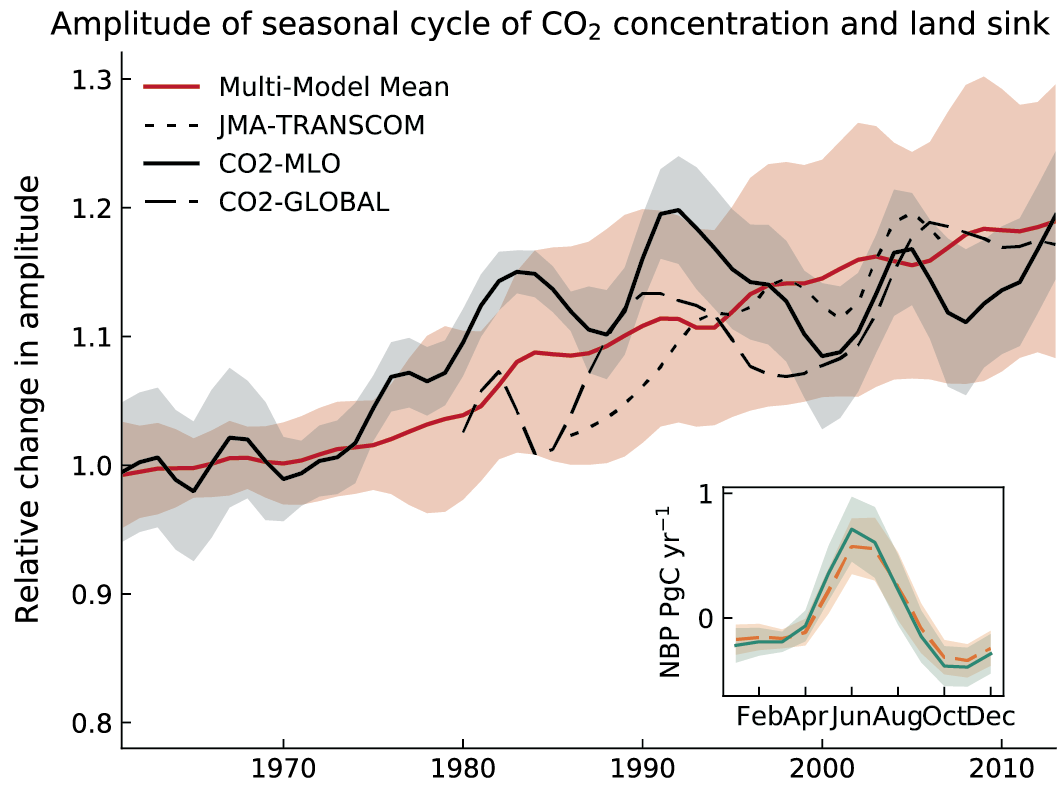
Figure caption
Figure 3.32 | Relative change in the amplitude of the seasonal cycle of global land carbon uptake in the historical CMIP6 simulations from 1961–2014. Net biosphere production estimates from 19 CMIP6 models (red), the data-led reconstruction JMA-TRANSCOM (Maki et al., 2010; dotted) and atmospheric CO2 seasonal cycle amplitude changes from observations (global as dashed line, Mauna Loa Observatory (MLO) (Dlugokencky et al., 2020) in bold black). Seasonal cycle amplitude is calculated using the curve fit algorithm package from the National Oceanic and Atmospheric Administration Earth System Research Laboratory (NOAA ESRL). Relative changes are referenced to the 1961–1970 mean and for short time series adjusted to have the same mean as the model ensemble in the last 10 years. Interannual variation was removed with a nine-year Gaussian smoothing. Shaded areas show the one sigma model spread (grey) for the CMIP6 ensemble and the one sigma standard deviation of the smoothing (red) for the CO2 MLO observations. Inset: average seasonal cycle of ensemble mean net biosphere production and its one sigma model spread for 1961–1970 (orange dashed line, light orange shading) and 2005–2014 (solid green line, green shading). Further details on data sources and processing are available in the chapter data table (Table 3.SM.1).