Back chapter figures
Figure 3.33
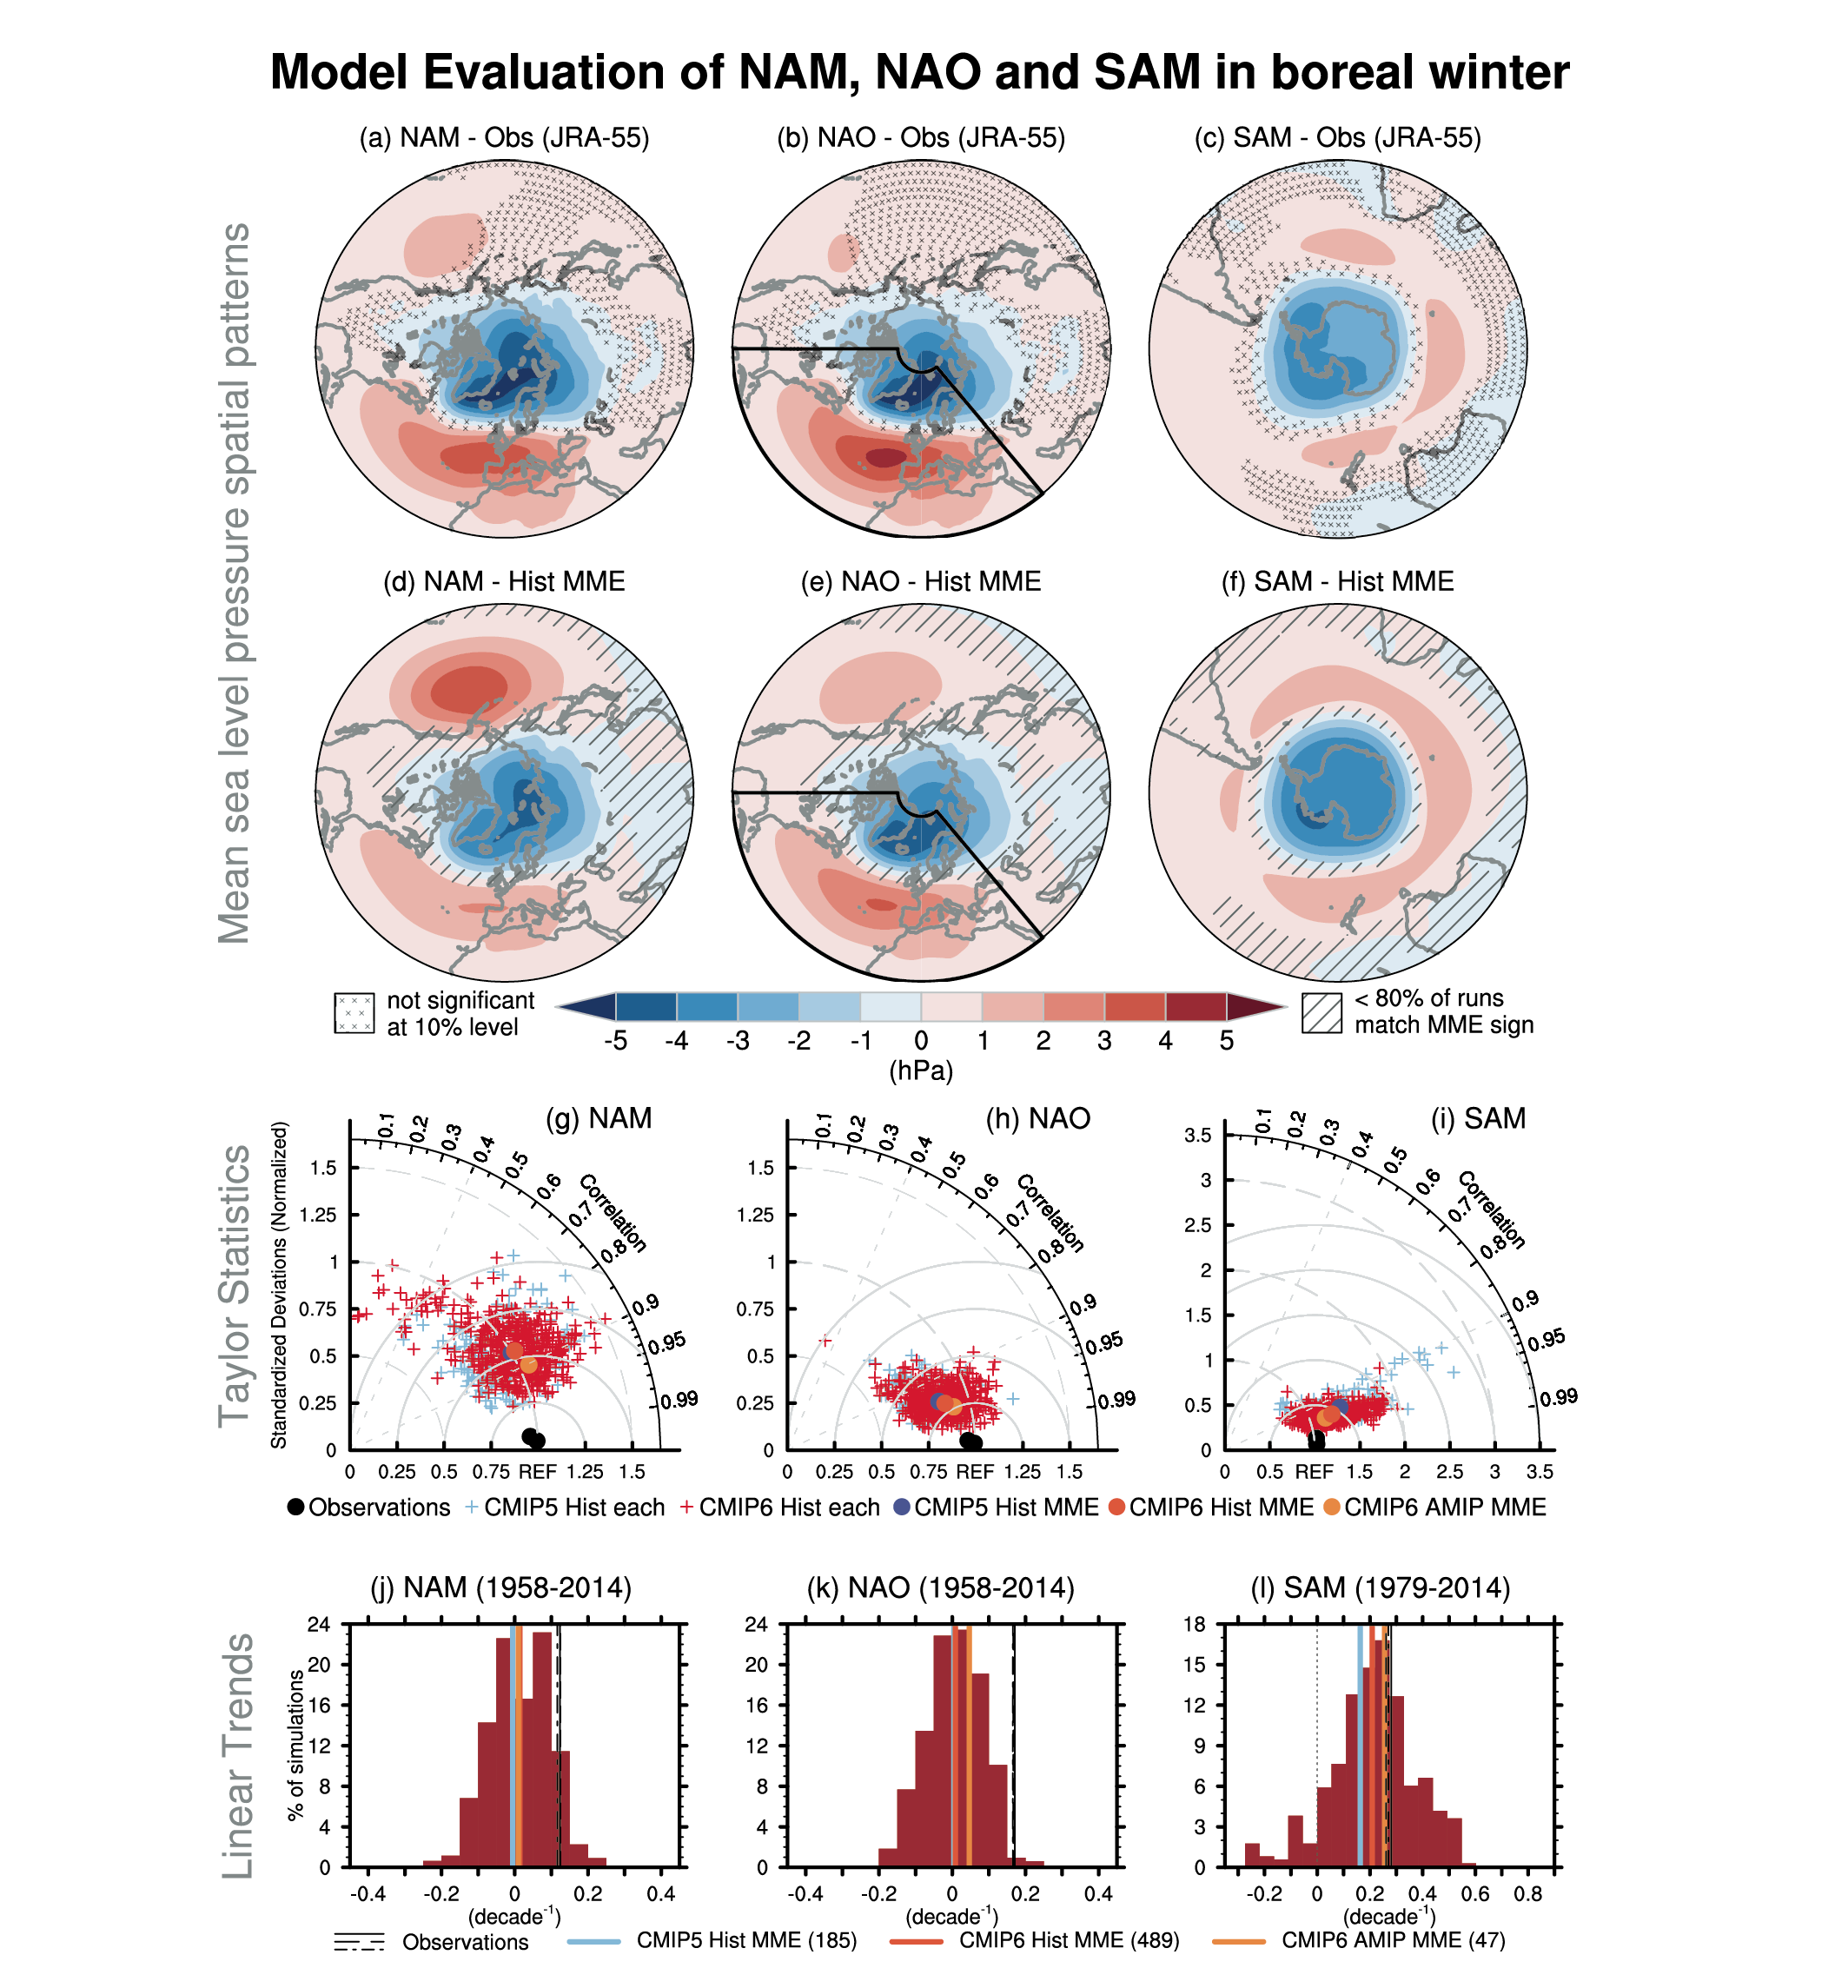
Figure caption
Figure 3.33 | Model evaluation of NAM, NAO and SAM in boreal winter. Regression of Mean Sea Level Pressure (MSLP) anomalies (in hPa) onto the normalized principal component (PC) of the leading mode of variability obtained from empirical orthogonal decomposition of the boreal winter (December–February) MSLP poleward of 20°N for the observed Northern Annular Mode (NAM, a), over 20°N–80°N, 90°W–40°E for the North Atlantic Oscillation as shown by the black sector (NAO, b), and poleward of 20°S for the Southern Annular Mode (SAM, c) for the JRA-55 reanalysis. Cross marks indicate regions where the anomalies are not significant at the 10% level based on a t-test. The period used to calculate the NAO/NAM is 1958–2014 but 1979–2014 for the SAM. (d–f) Same but for the multi-model ensemble (MME) mean from CMIP6 historical simulations. Models are weighted in compositing to account for differences in their respective ensemble size. Diagonal lines show regions where less than 80% of the runs agree in sign. (g–i) Taylor diagrams summarizing the representation of the modes in models and observations following Lee et al. (2019) for CMIP5 (light blue) and CMIP6 (red) historical simulations. The reference pattern is taken from JRA-55 (a–c). The ratio of standard deviation to that of the reference observations (radial distance), spatial correlation (radial angle) and resulting root-mean-squared errors (solid isolines) are given for individual ensemble members (crosses) and for other observational products (ERA5 and NOAA 20CR version 3, black dots). Coloured dots stand for weighted multi-model mean statistics for CMIP5 (blue) and CMIP6 (light red) as well as for AMIP simulations from CMIP6 (orange). (j–l) Histograms of the trends built from all individual ensemble members and all the models (brown bars). Vertical lines in black show all the observational estimates. The orange, light red, and light blue lines indicate the weighted multi-model mean of CMIP6 AMIP, CMIP6 and CMIP5 historical simulations, respectively. Further details on data sources and processing are available in the chapter data table (Table 3.SM.1).