Back chapter figures
Figure 3.34
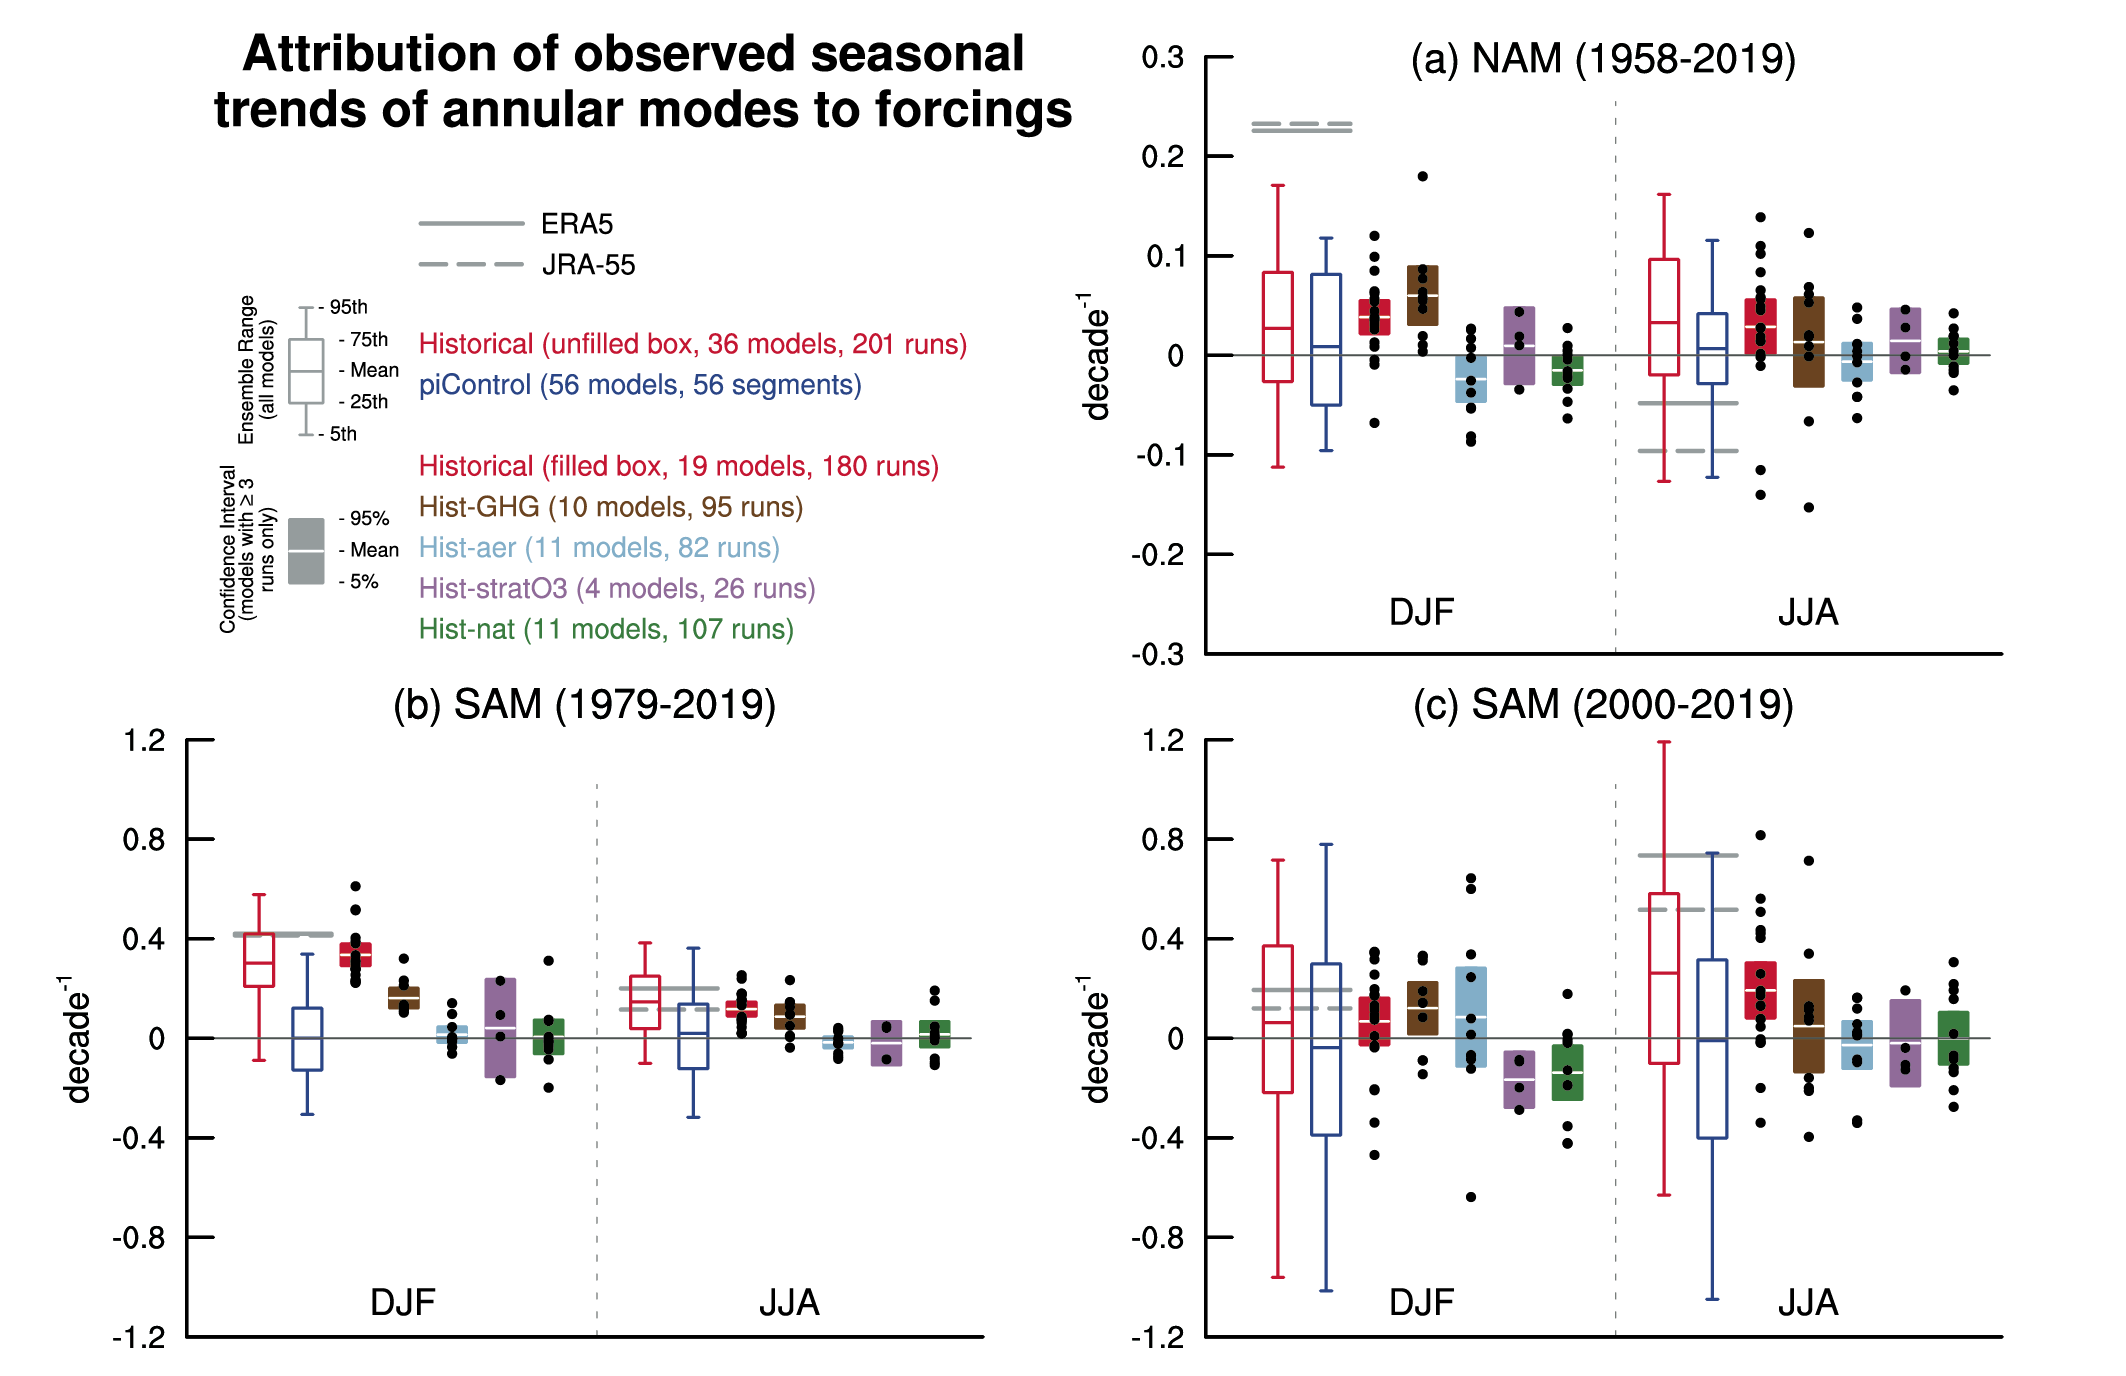
Figure caption
Figure 3.34 | Attribution of observed seasonal trends in the annular modes to forcings. Simulated and observed trends in NAM indices over 1958–2019 (a) and in SAM indices over 1979–2019 (b) and over 2000–2019 (c) for boreal winter (December–February average; DJF) and summer (June–August average; JJA). The indices are based on the difference of the normalized zonally averaged monthly mean sea level pressure between 35°N and 65°N for the NAM and between 40°S and 65°S for the SAM as defined in Jianping and Wang (2003) and Gong and Wang (1999), respectively; the unit is decade–1. Ensemble mean, interquartile ranges and 5th and 95th percentiles are represented by empty boxes and whiskers for pre-industrial control simulations and historical simulations. The number of ensemble members and models used for computing the distribution is given in the upper-left legend. Grey lines show observed trends from the ERA5 and JRA-55 reanalyses. Multi-model multi-member ensemble means of the forced component of the trends as well as their 5–95% confidence intervals assessed from t-statistics, are represented by filled boxes, based on CMIP6 individual forcing simulations from DAMIP ensembles; greenhouse gases in brown, aerosols in light blue, stratospheric ozone in purple and natural forcing in green. Models with at least three ensemble members are used for the filled boxes, with black dots representing the ensemble means of individual models. Further details on data sources and processing are available in the chapter data table (Table 3.SM.1).