Back chapter figures
Figure 3.36
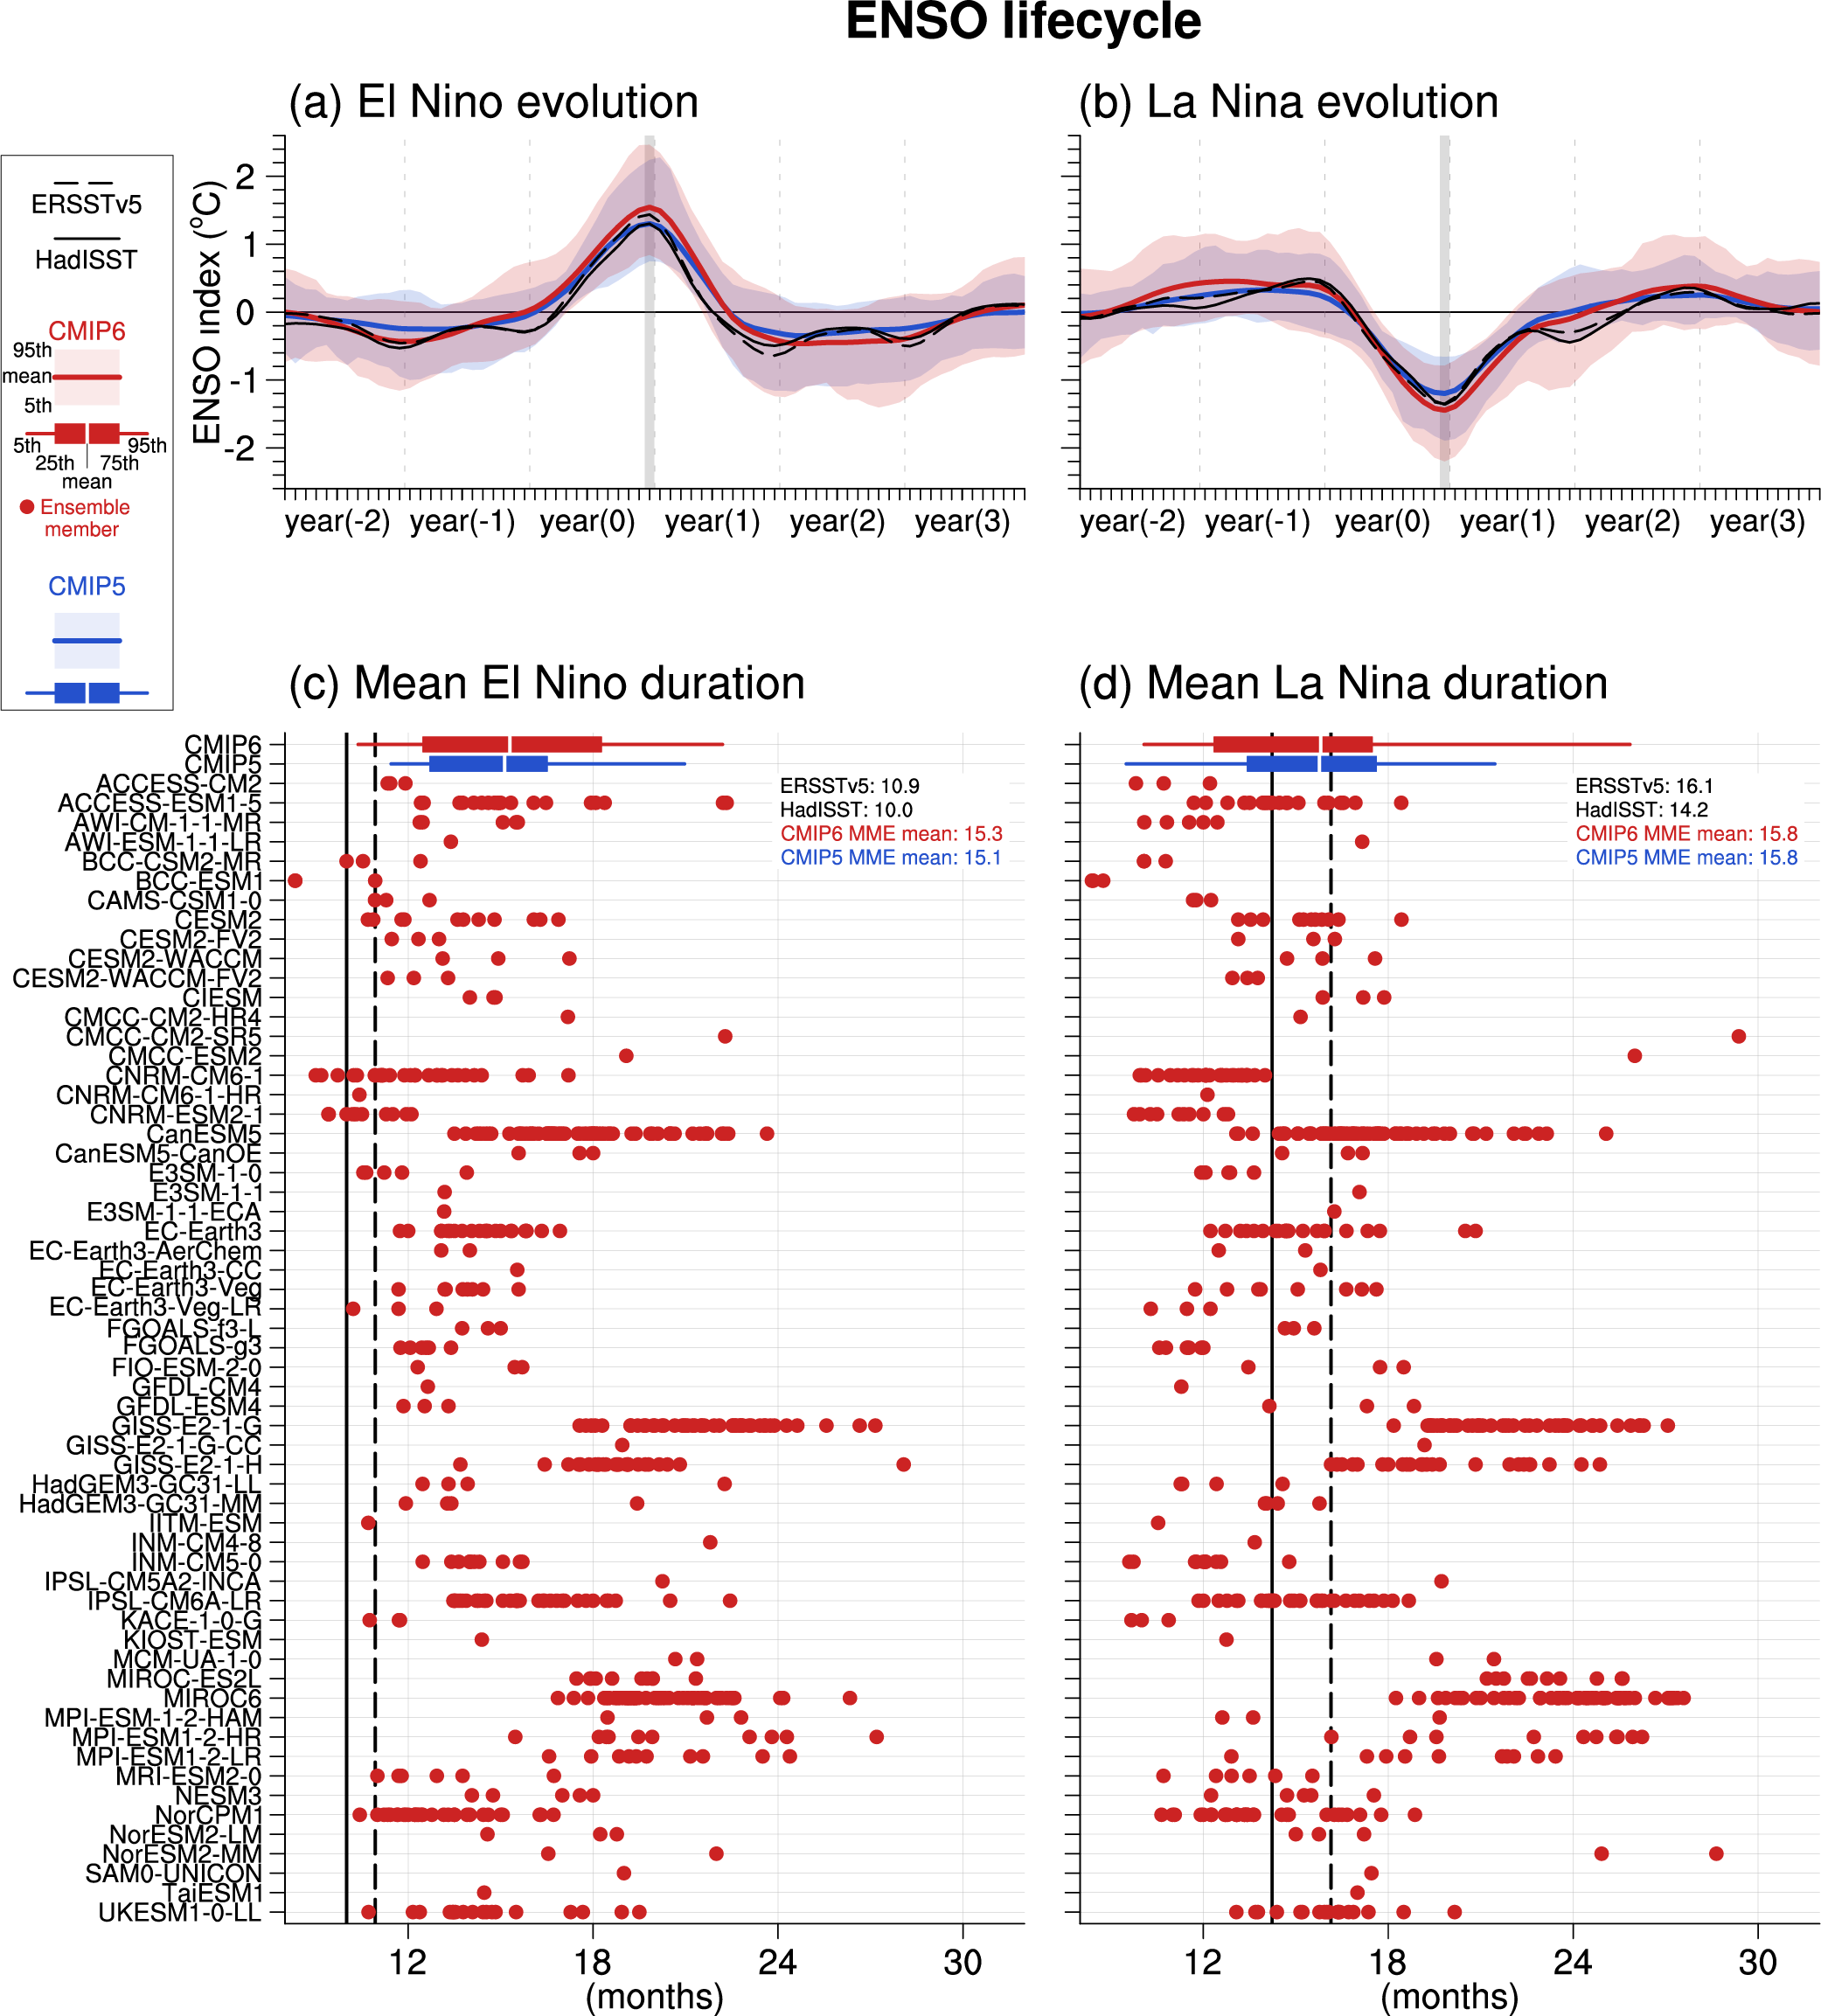
Figure caption
Figure 3.36 | Life cycle of (left) El Niño and (right) La Niña events in observations (black) and historical simulations from CMIP5 (blue; extended with RCP4.5) and CMIP6 (red). An event is detected when the December ENSO index value in year zero exceeds 0.75 times its standard deviation for 1951–2010. (a, b) Composites of the ENSO index (°C). The horizontal axis represents month relative to the reference December (the grey vertical bar), with numbers in parentheses indicating relative years. Shading and lines represent 5th–95th percentiles and multi-model ensemble means, respectively. (c, d) Mean durations (months) of El Niño and La Niña events defined as number of months in individual events for which the ENSO index exceeds 0.5 times its December standard deviation. Each dot represents an ensemble member from the model indicated on the vertical axis. The boxes and whiskers represent multi-model ensemble means, interquartile ranges and 5th and 95th percentiles of CMIP5 and CMIP6. The CMIP5 and CMIP6 multi-model ensemble means and observational values are indicated at the top right of each panel. The multi-model ensemble means and percentile values are evaluated after weighting individual members with the inverse of the ensemble size of the same model, so that individual models are equally weighted irrespective of their ensemble sizes. The ENSO index is defined as the SST anomaly averaged over the Niño 3.4 region (5°S–5°N, 170°W–120°W). All results are based on five-month running mean SST anomalies with triangular-weights after linear detrending. Further details on data sources and processing are available in the chapter data table (Table 3.SM.1).