Back chapter figures
Figure 3.38
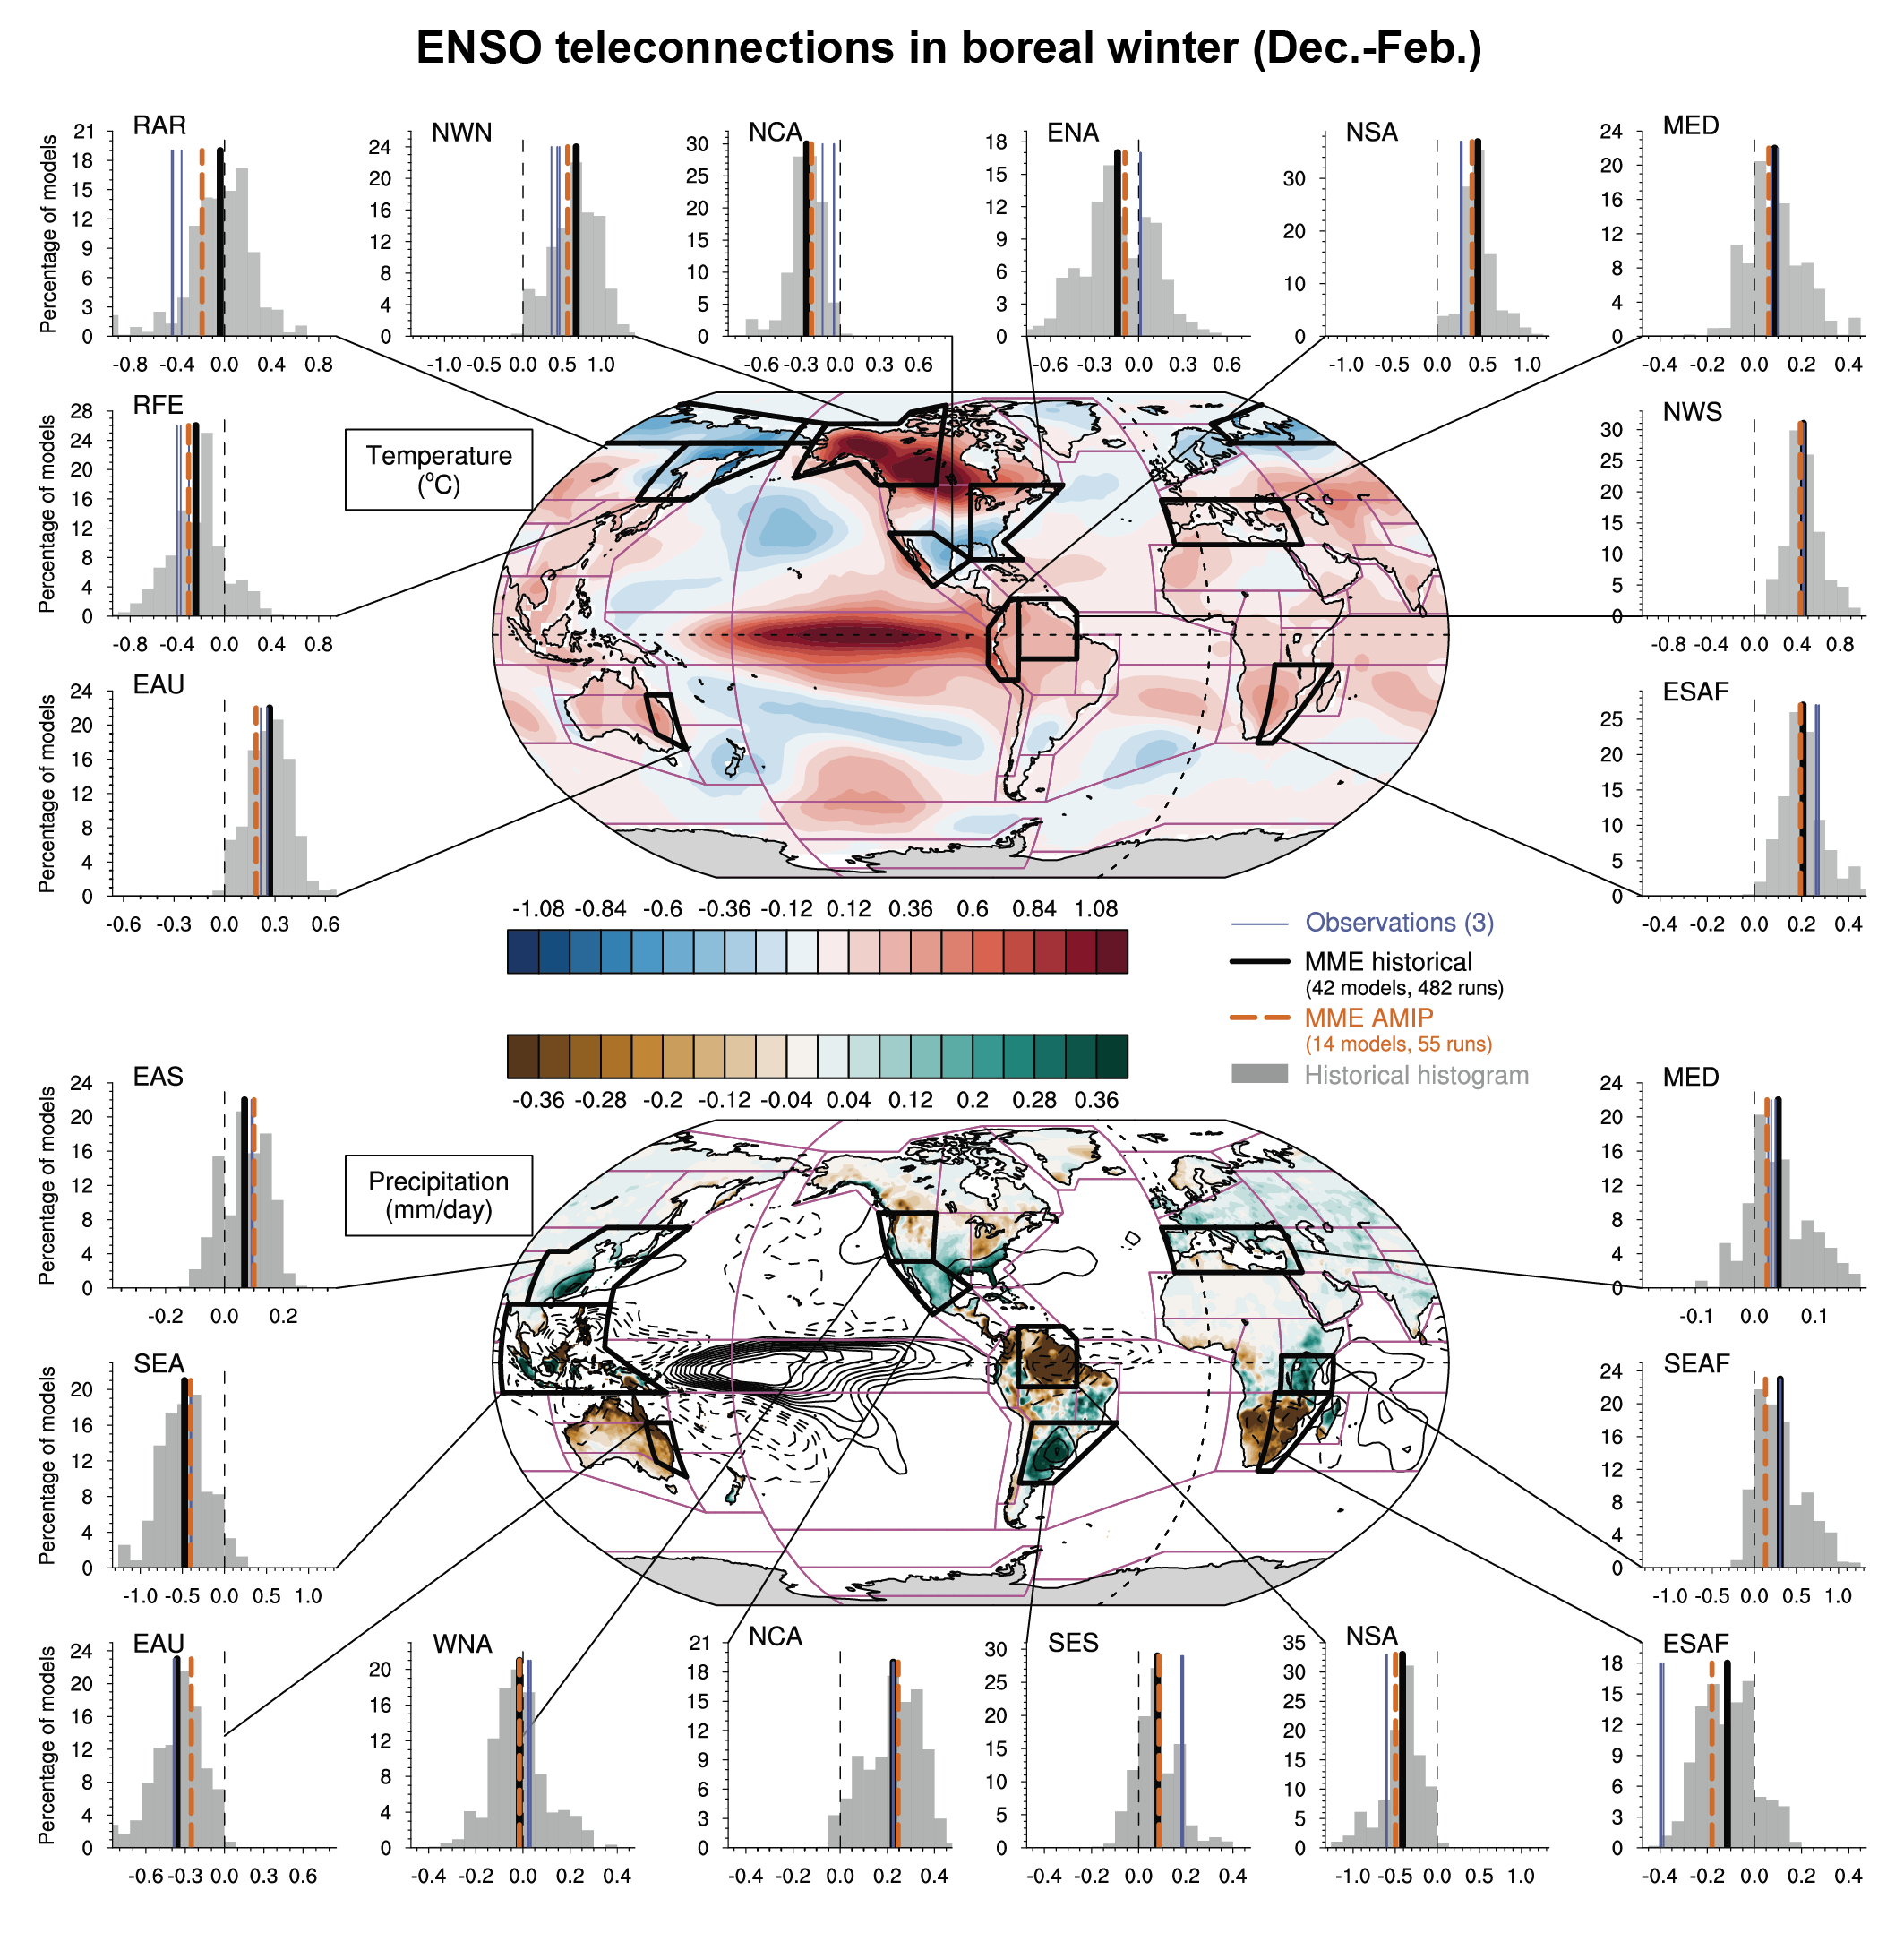
Figure caption
Figure 3.38 | Model evaluation of ENSO teleconnection for near surface air temperature and precipitation in boreal winter (December–January–February). Teleconnections are identified by linear regression with the Niño 3.4 SST index based on Extended Reconstructed Sea Surface Temperature (ERSST) version 5 over the period 1958–2014. Maps show observed patterns for temperature from the Berkeley Earth dataset over land and from ERSST version 5 over ocean (°C, top) and for precipitation from GPCC over land (shading, mm day–1) and GPCP worldwide (contours, period: 1979–2014). Distributions of regression coefficients (grey histograms) are provided for a subset of AR6 reference regions defined in Atlas.1.3 for temperature (top) and precipitation (bottom). All fields are linearly detrended prior to computation. Multi-model multi-member ensemble means are indicated by thick vertical black lines. Blue vertical lines show three observational estimates of temperature, based on Berkeley Earth, GISTEMP and CRUTS datasets, and two observational estimates of precipitation, based on GPCC and CRUTS datasets. Further details on data sources and processing are available in the chapter data table (Table 3.SM.1).