Back chapter figures
Figure 3.4
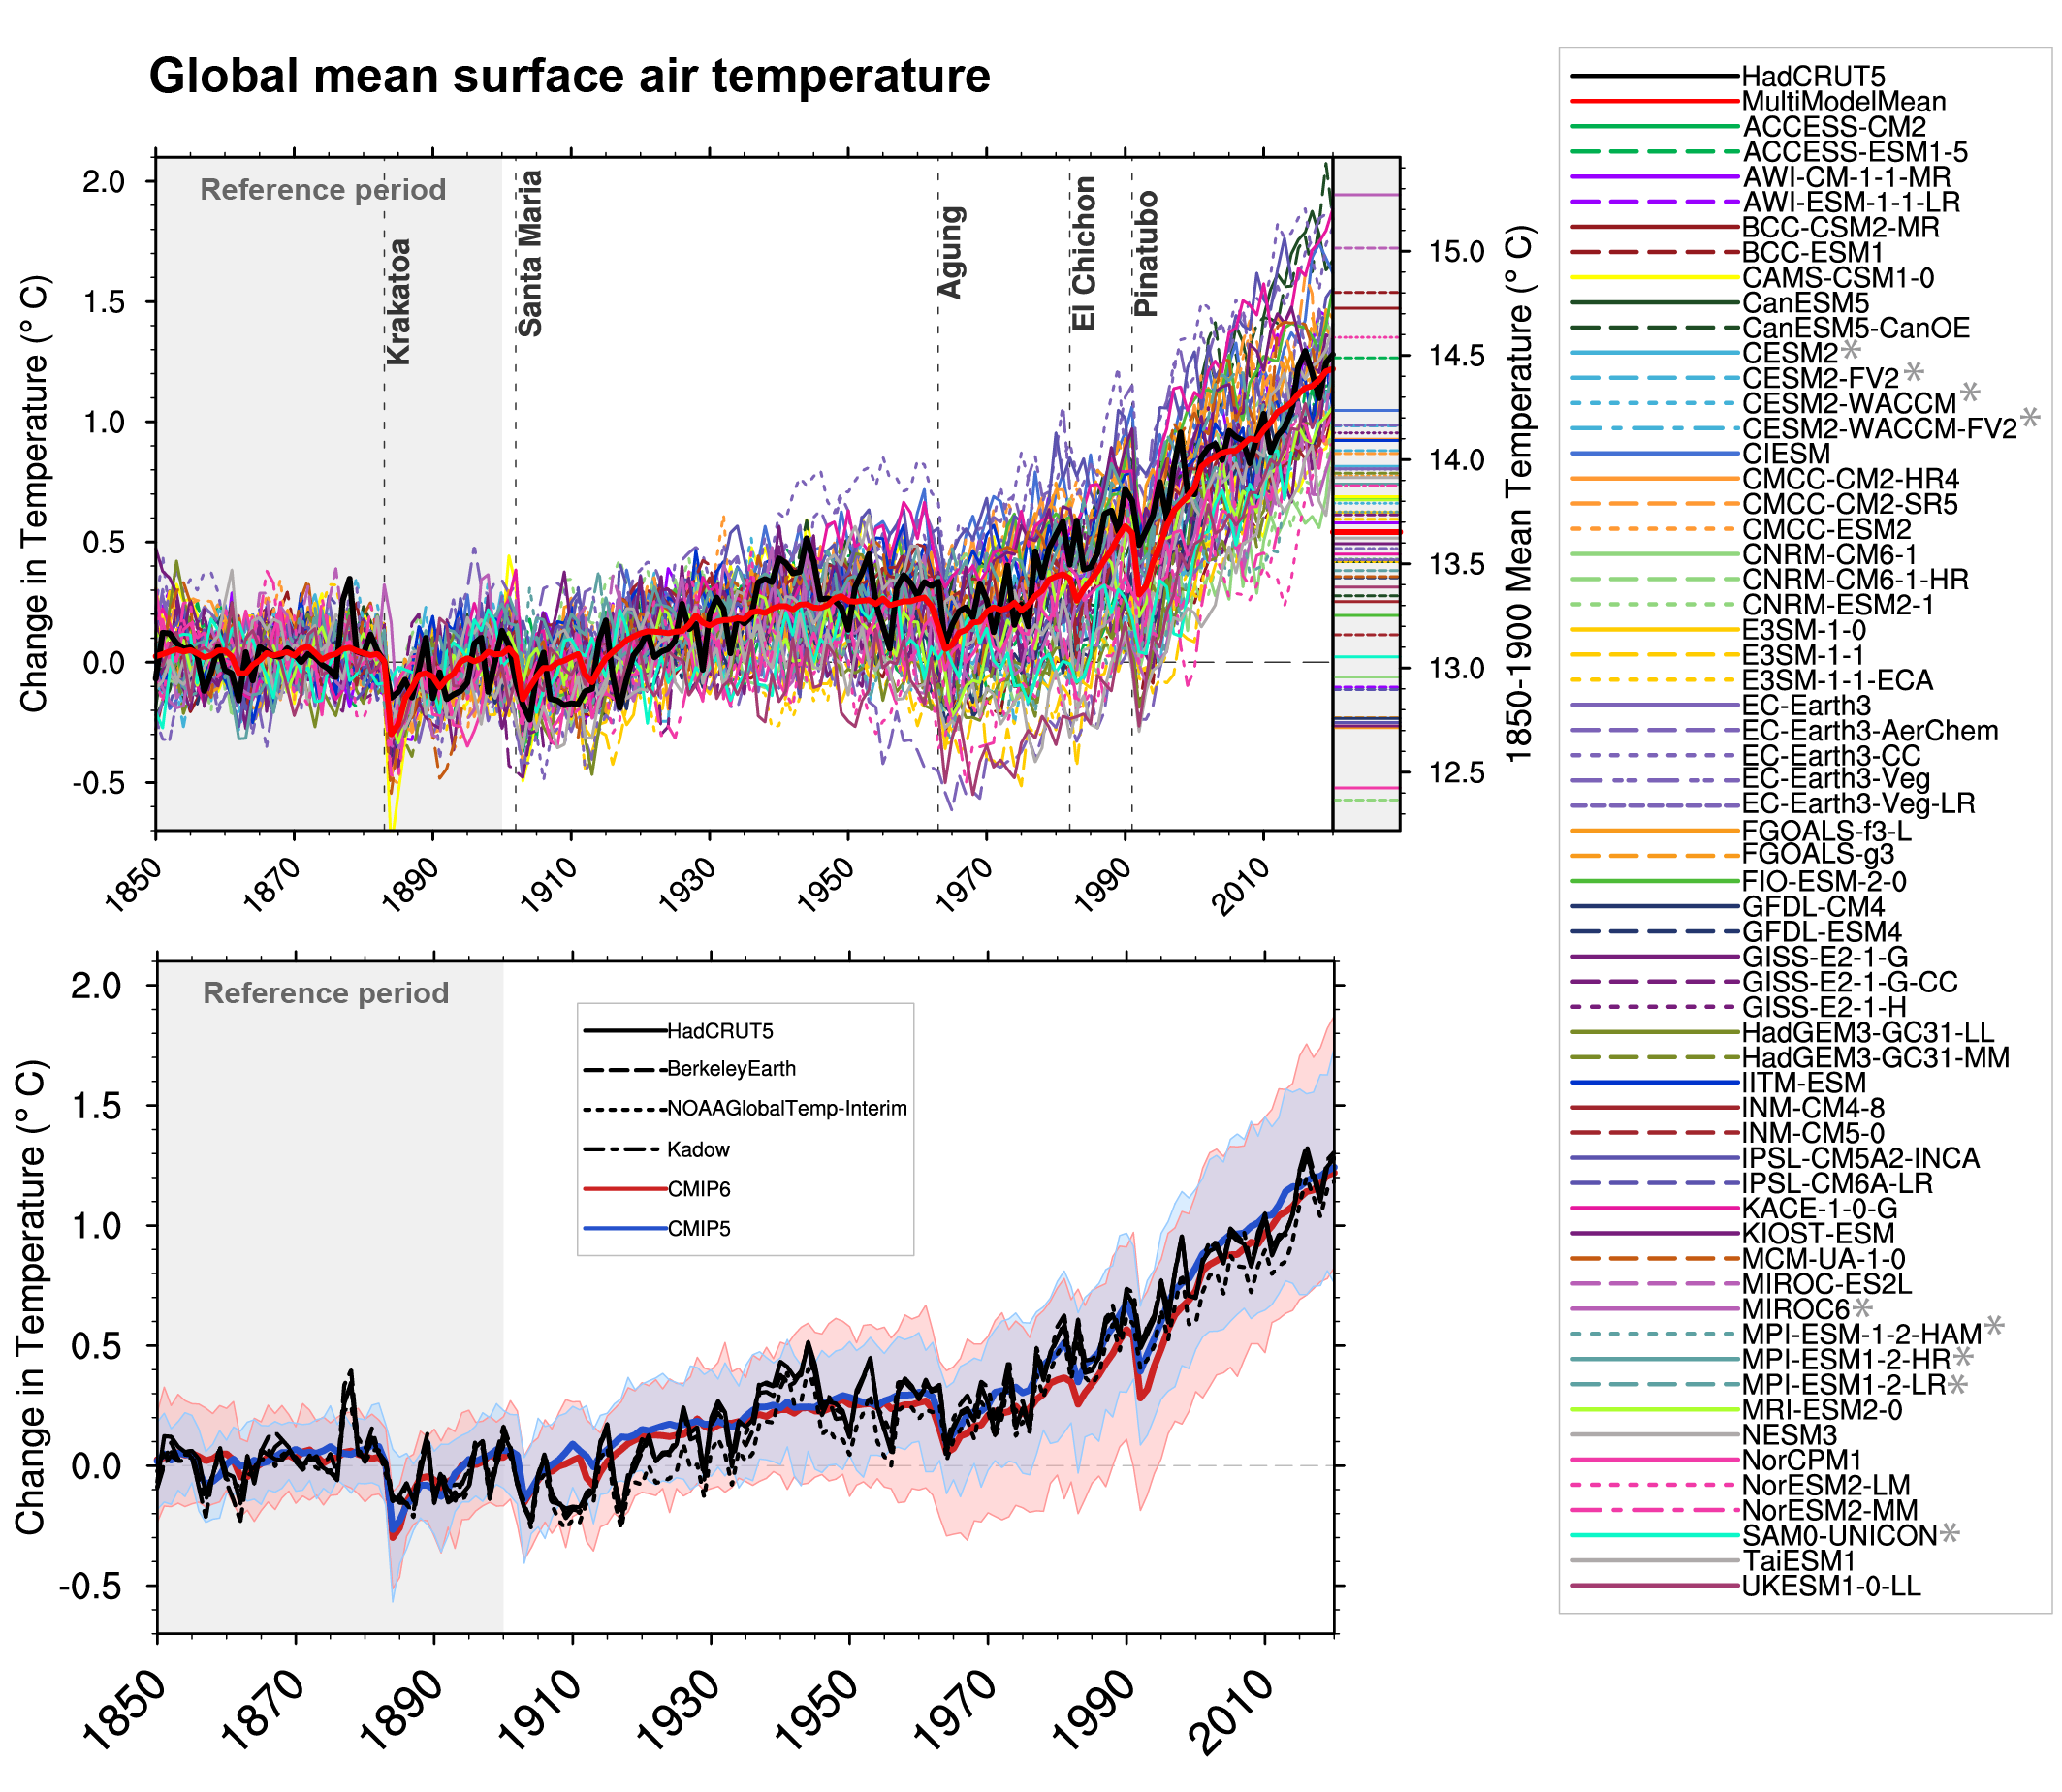
Figure caption
Figure 3.4 | Observed and simulated time series of the anomalies in annual and global mean surface air temperature (GSAT). All anomalies are differences from the 1850–1900 time-mean of each individual time series. The reference period 1850–1900 is indicated by grey shading. (a) Single simulations from CMIP6 models (thin lines) and the multi-model mean (thick red line). Observational data (thick black lines) are from the Met Office Hadley Centre/Climatic Research Unit dataset (HadCRUT5), and are blended surface temperature (2 m air temperature over land and sea surface temperature over the ocean). All models have been subsampled using the HadCRUT5 observational data mask. Vertical lines indicate large historical volcanic eruptions. CMIP6 models which are marked with an asterisk are either tuned to reproduce observed warming directly, or indirectly by tuning equilibrium climate sensitivity. Inset: GSAT for each model over the reference period, not masked to any observations. (b) Multi-model means of CMIP5 (blue line) and CMIP6 (red line) ensembles and associated 5th to 95th percentile ranges (shaded regions). Observational data are HadCRUT5, Berkeley Earth, National Oceanic and Atmospheric Administration NOAAGlobalTemp-Interim and Kadow et al. (2020). Masking was done as in (a). CMIP6 historical simulations were extended with SSP2-4.5 simulations for the period 2015–2020 and CMIP5 simulations were extended with RCP4.5 simulations for the period 2006–2020. All available ensemble members were used (see Section 3.2). The multi-model means and percentiles were calculated solely from simulations available for the whole time span (1850–2020). Figure is updated from Bock et al. (2020), their Figures 1 and 2. CC BY 4.0https://creativecommons.org/licenses/by/4.0/. Further details on data sources and processing are available in the chapter data table (Table 3.SM.1).