Back chapter figures
Figure 3.40
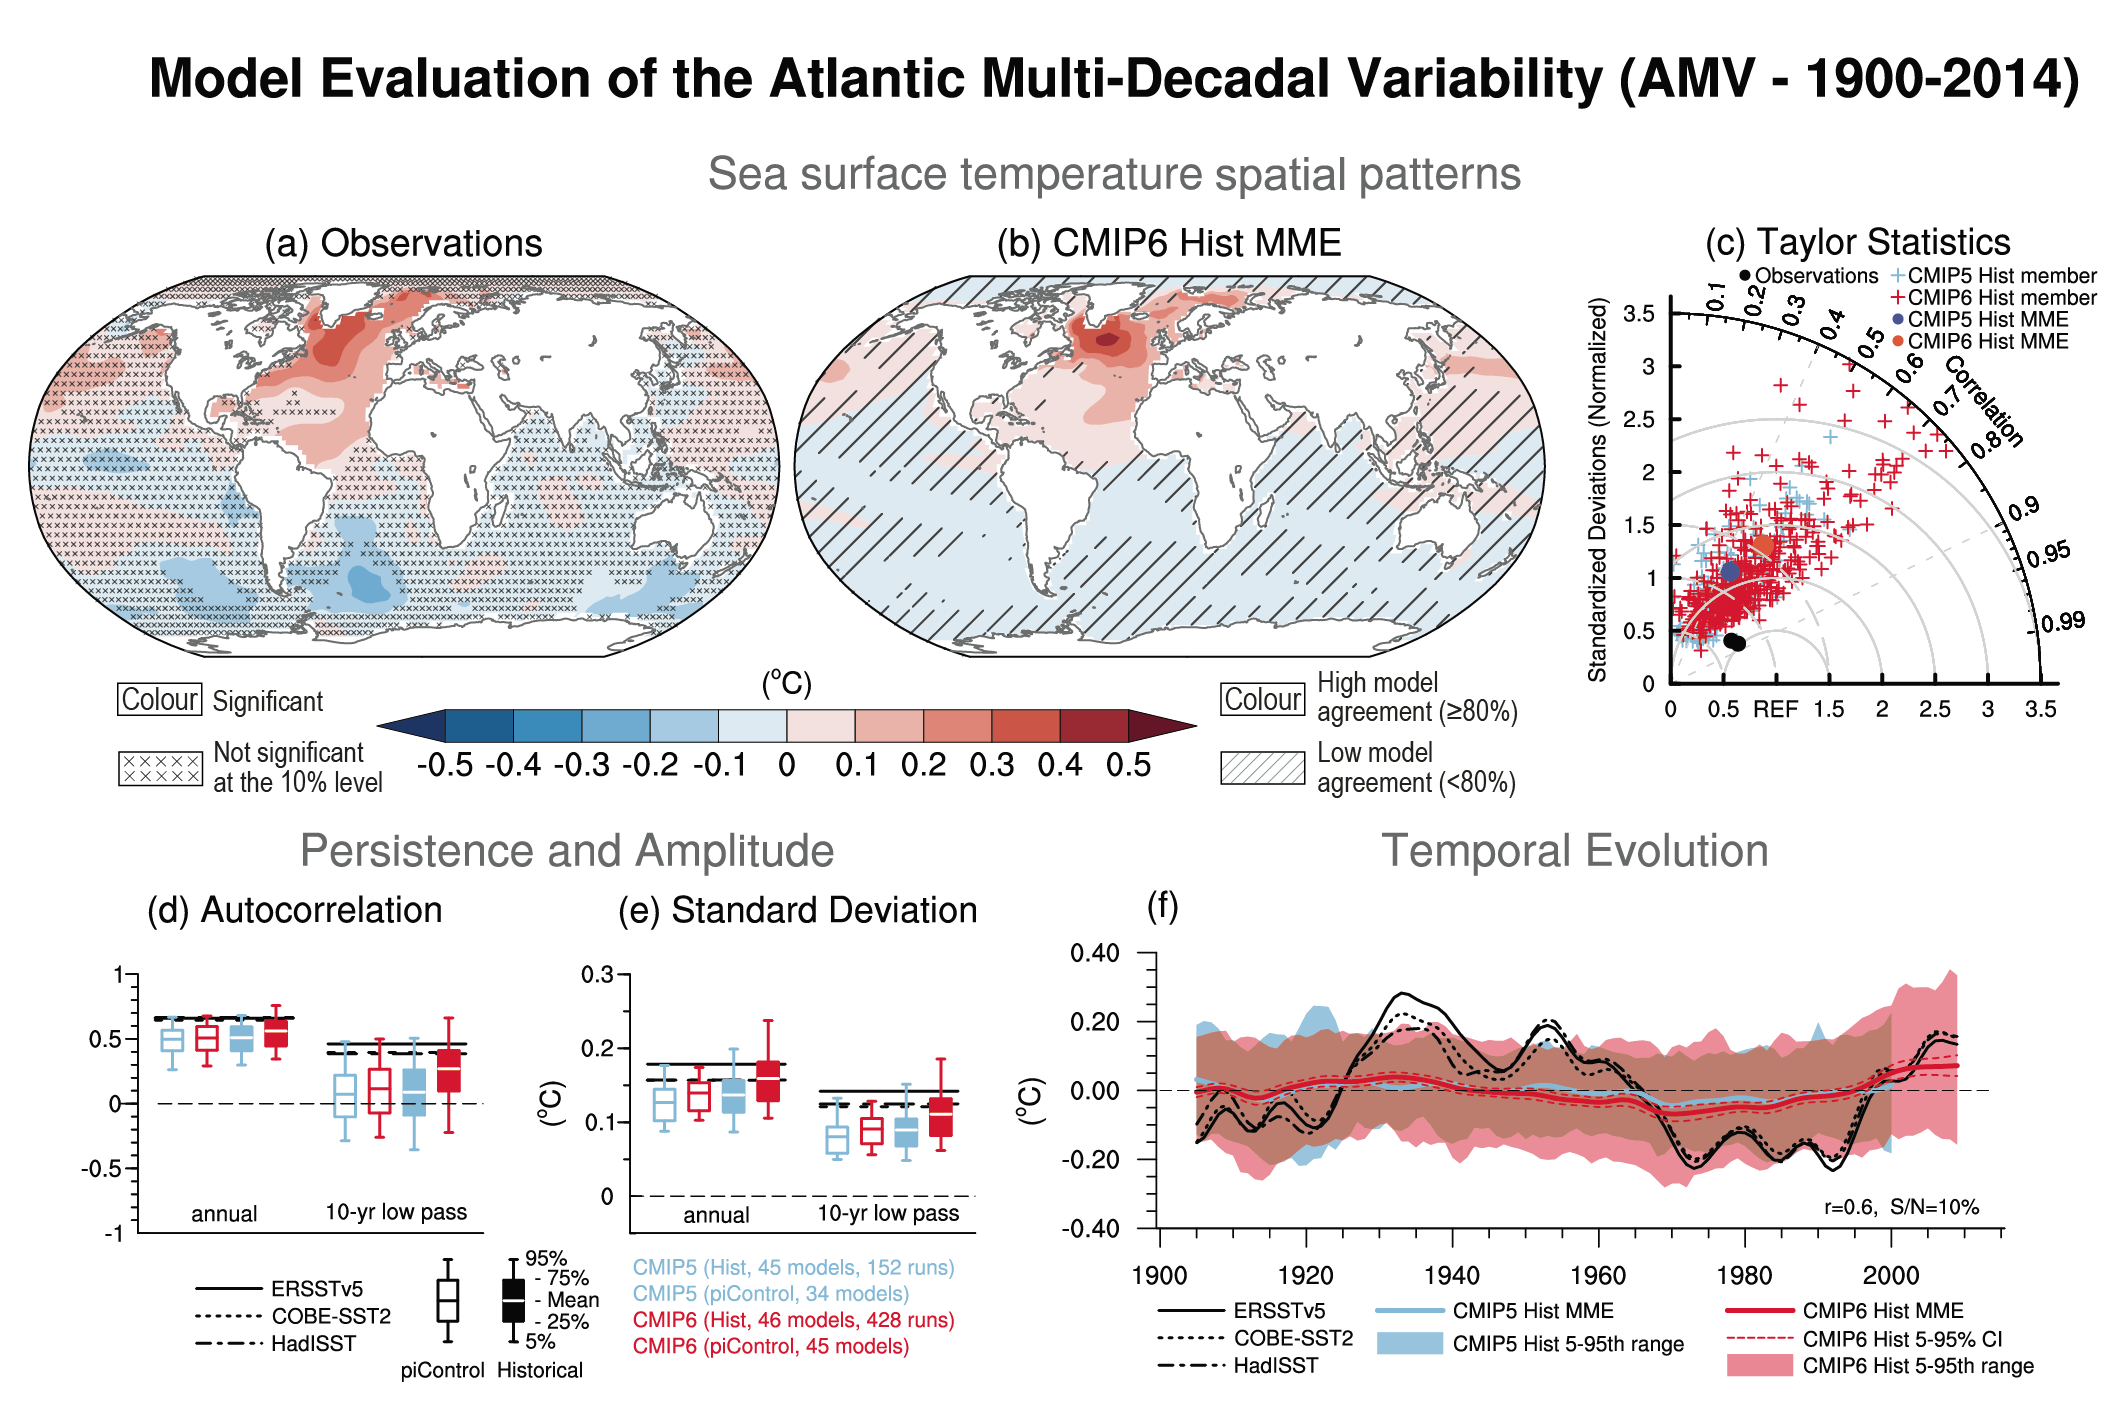
Figure caption
Figure 3.40 | Model evaluation of Atlantic Multi-decadal Variability (AMV). (a, b) Sea surface temperature (SST) anomalies (°C) regressed onto the AMV index defined as the 10-year low-pass filtered North Atlantic (0°–60°N, 80°W–0°E) area-weighted SST* anomalies over 1900–2014 in (a) ERSST version 5 and (b) the CMIP6 multi-model ensemble (MME) mean composite obtained by weighting ensemble members by the inverse of each model’s ensemble size. The asterisk denotes that the global mean SST anomaly has been removed at each time step of the computation. Cross marks in (a) represent regions where the anomalies are not significant at the 10% level based on a t-test. Diagonal lines in (b) show regions where less than 80% of the runs agree in sign. (c) A Taylor diagram summarizing the representation of the AMV pattern in CMIP5 (each ensemble member is shown as a cross in light blue, and the weighted multi-model mean is shown as a dot in dark blue), CMIP6 (each ensemble member is shown as a cross in red, and the weighted multi-model mean is shown as a dot in orange) and observations over [0°–60°N, 80°W–0°E]. The reference pattern is taken from ERSST version 5 and black dots indicate other observational products (HadISST version 1 and COBE-SST2). (d) Autocorrelation of unfiltered annual AMV index at lag one year and 10-year low-pass filtered AMV index at lag 10 years for observations over 1900–2014 (horizontal lines), 115-year chunks of pre-industrial control simulations (open boxes) and individual historical simulations over 1900–2014 (filled boxes) from CMIP5 (blue) and CMIP6 (red). (e) As in (d), but showing standard deviation of the unfiltered and filtered AMV indices (°C). Boxes and whiskers show the weighted multi-model means, interquartile ranges and 5th and 95th percentiles. (f) Time series of the AMV index (°C) in ERSST version 5, HadISST version 1 and COBE-SST2 observational estimates (black) and CMIP5 and CMIP6 historical simulations. The thick red and light blue lines are the weighted multi-model mean for the historical simulations in CMIP5 and CMIP6, respectively, and the envelopes represent the 5th–95th percentile ranges obtained from all ensemble members. The 5–95% confidence interval for the CMIP6 multi-model mean is shown by the thin dashed line. Further details on data sources and processing are available in the chapter data table (Table 3.SM.1).