Back chapter figures
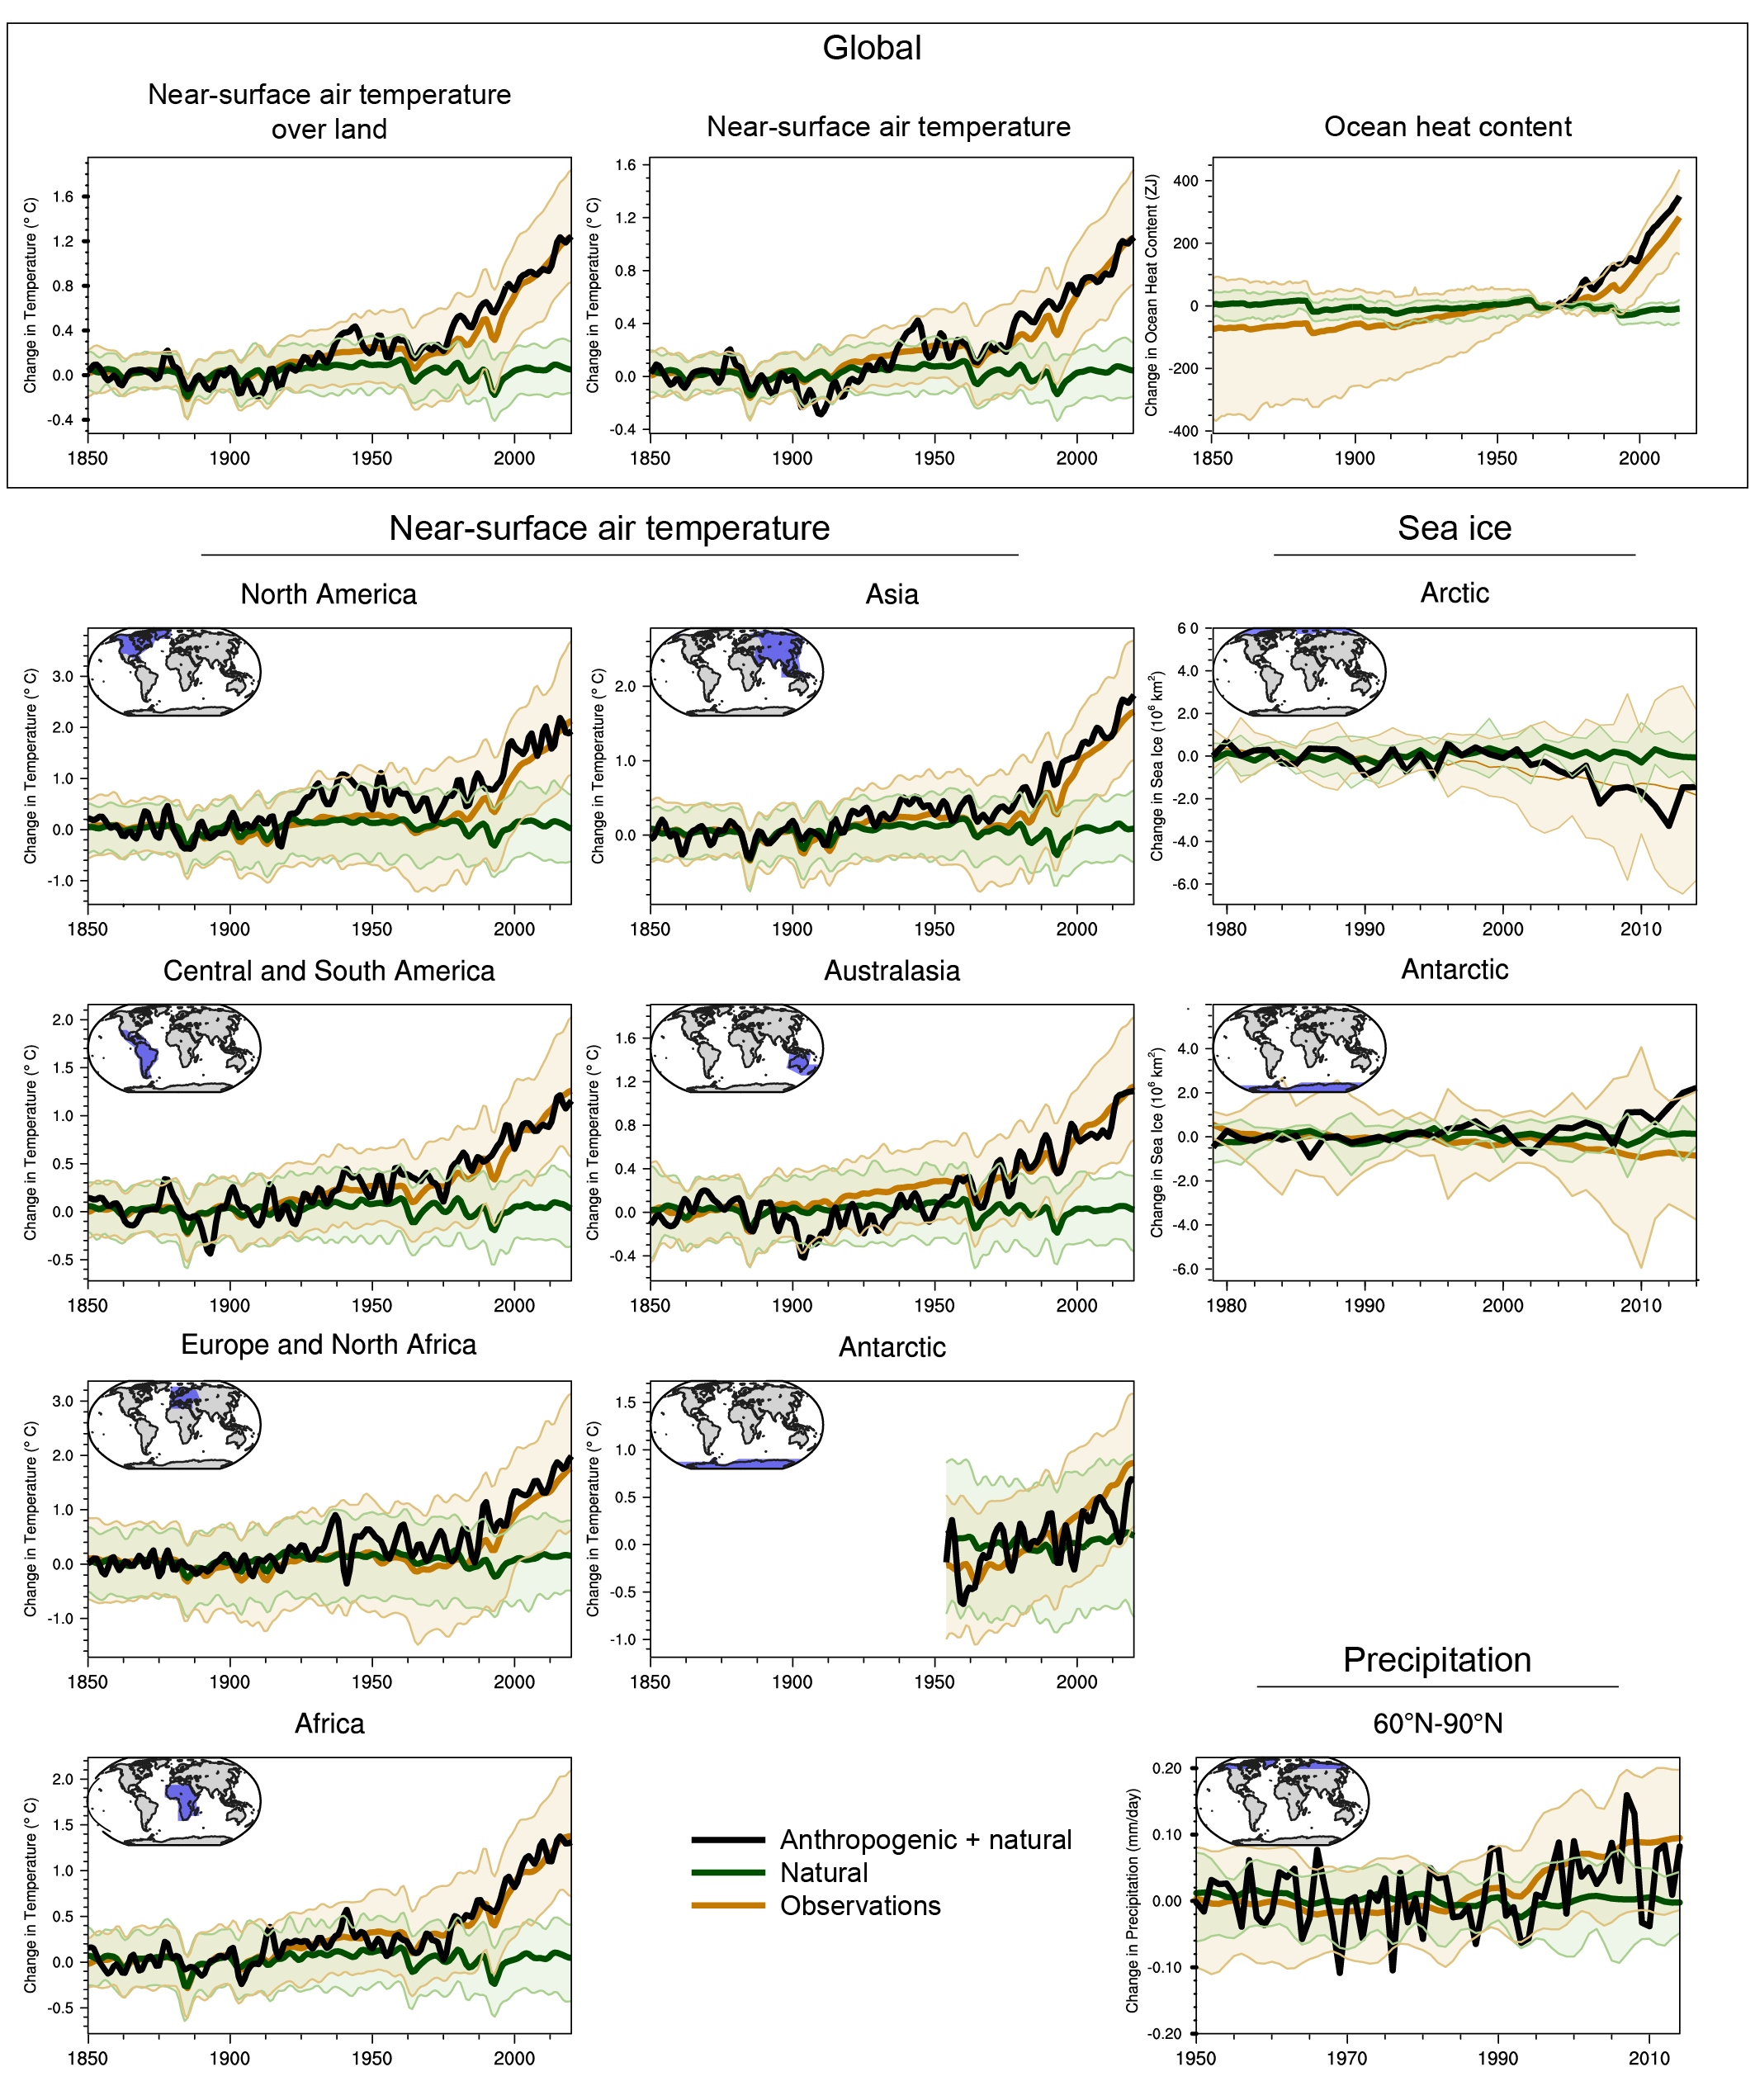
Figure 3.41
Figure caption
Figure 3.41 | Summary figure showing simulated and observed changes in key large-scale indicators of climate change across the climate system, for continental, ocean basin and larger scales. Black lines show observations, brown lines and shading show the multi-model mean and 5th–95th percentile ranges for CMIP6 historical simulations including anthropogenic and natural forcing, and blue lines and shading show corresponding ensemble means and 5th–95th percentile ranges for CMIP6 natural-only simulations. Temperature time series are as in Figure 3.9, but with smoothing using a low pass filter. Precipitation time series are as in Figure 3.15 and ocean heat content as in Figure 3.26. Further details on data sources and processing are available in the chapter data table (Table 3.SM.1).
