Back chapter figures
Figure 3.42
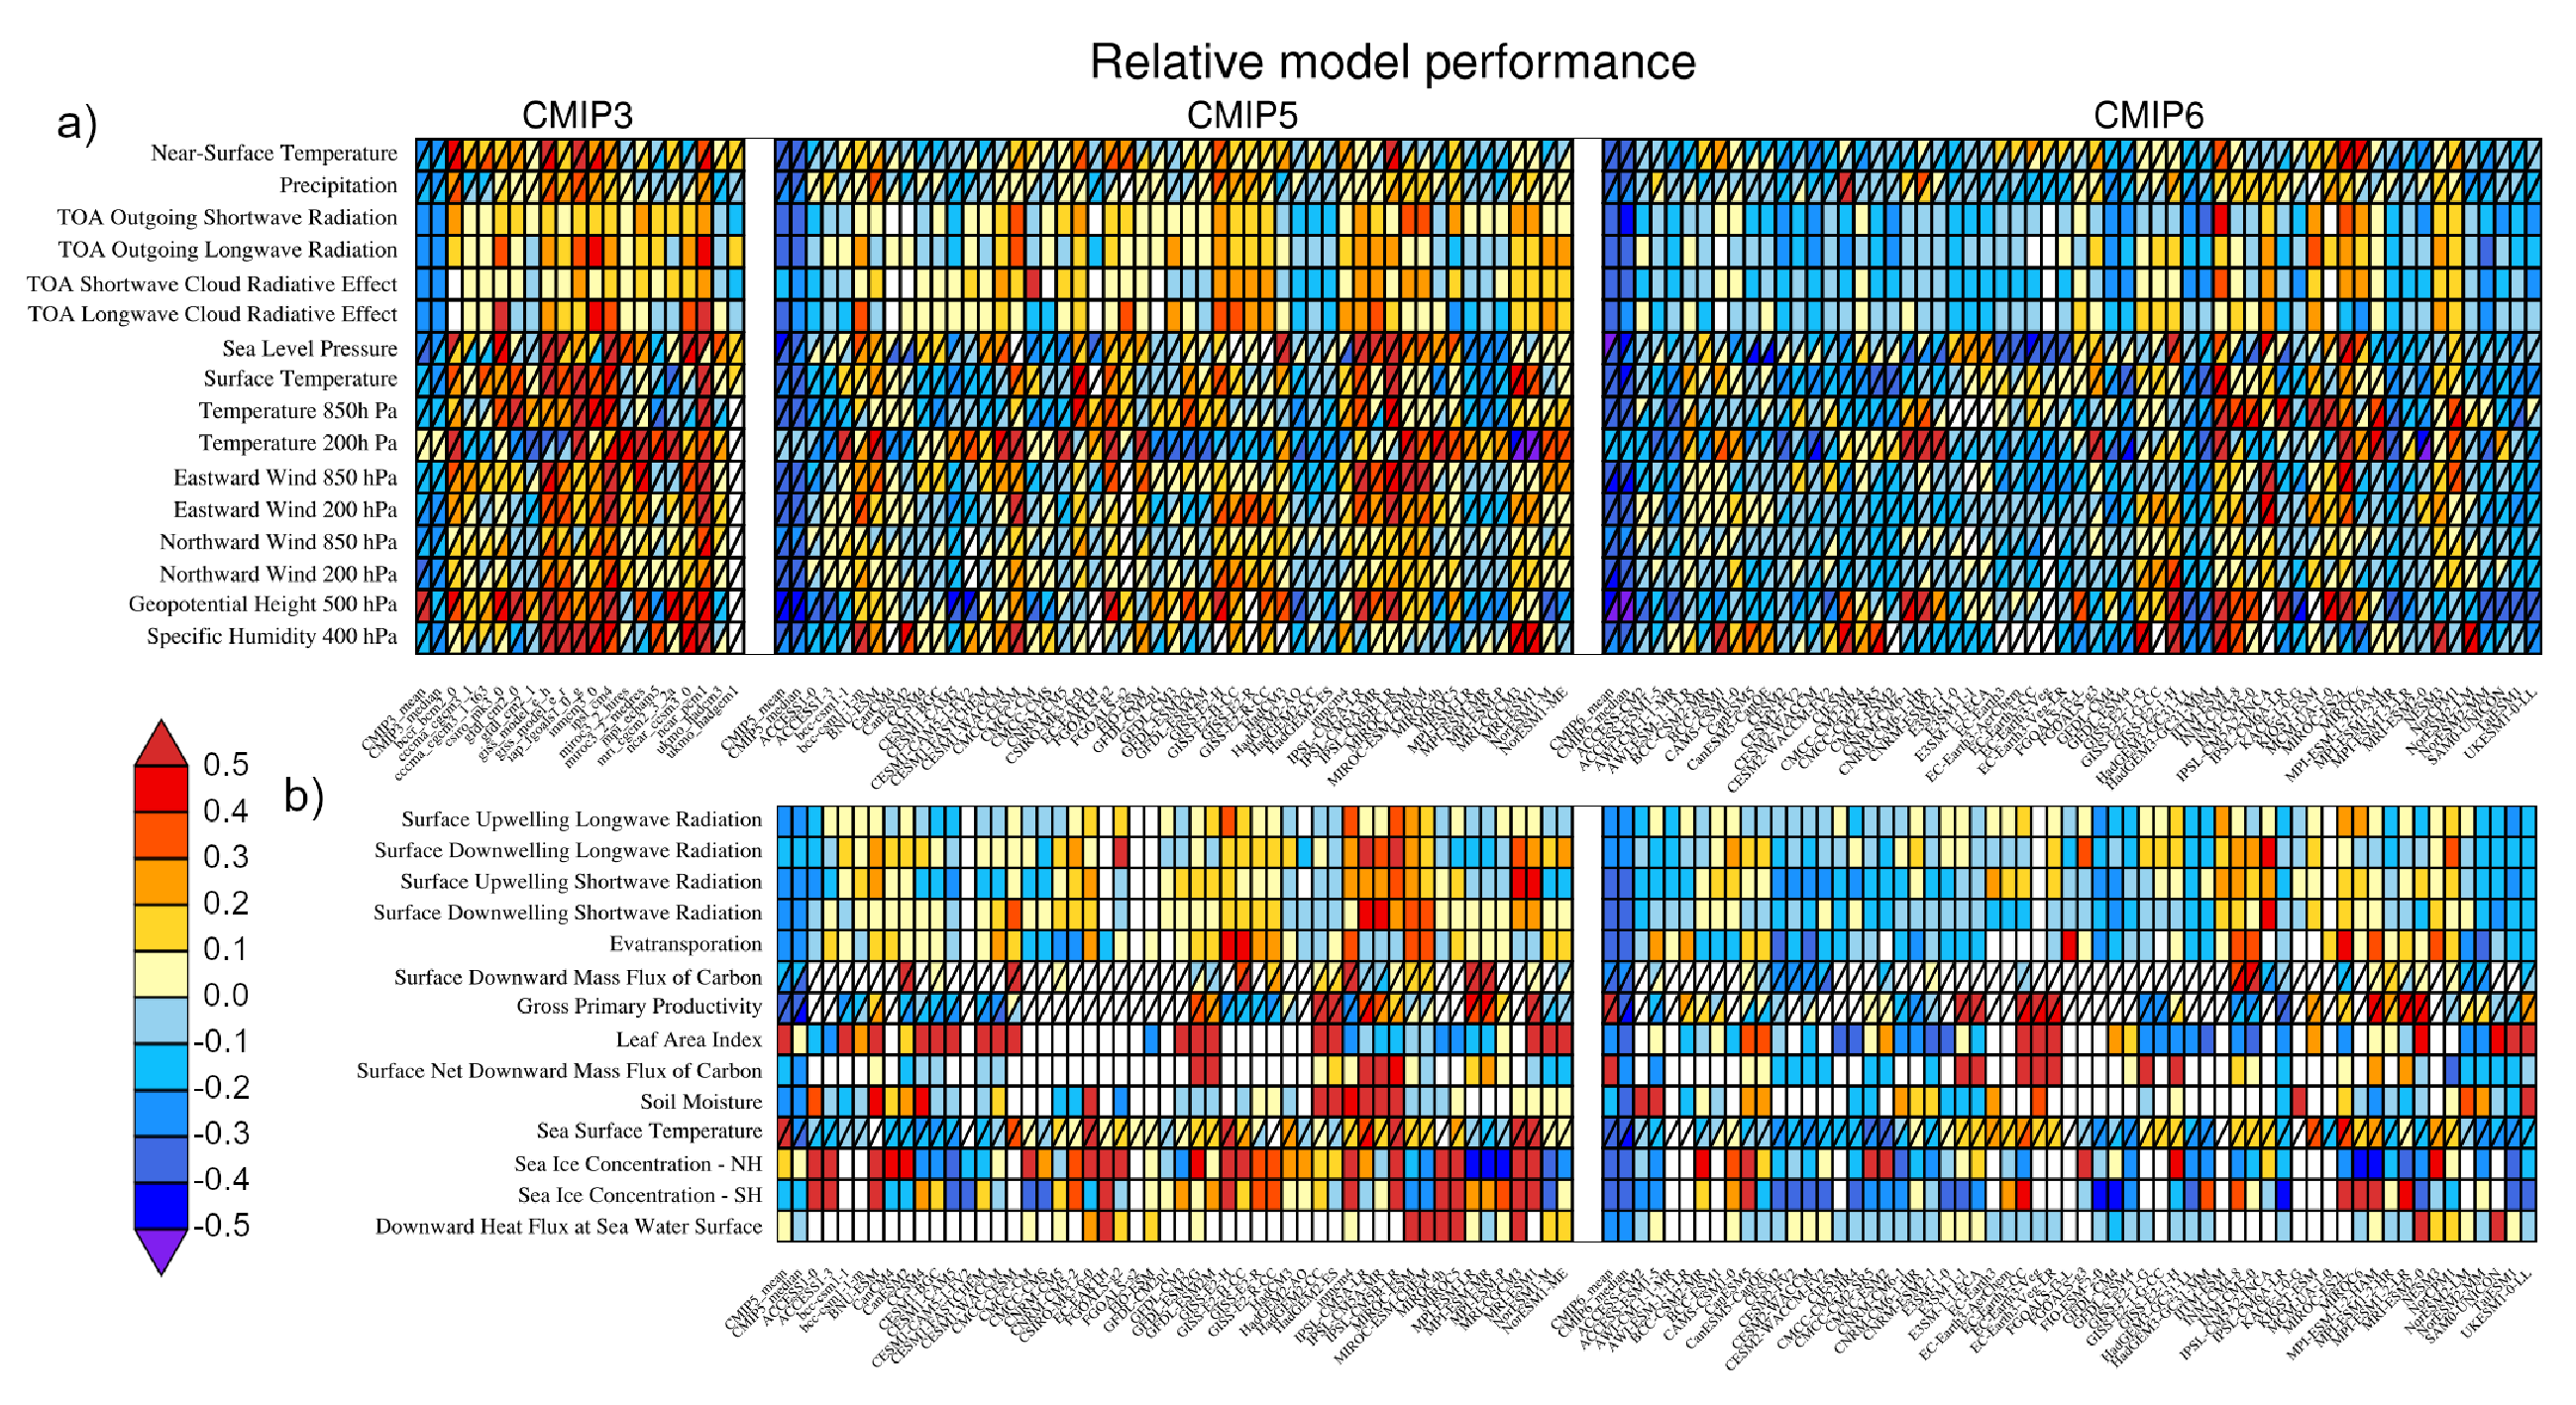
Figure caption
Figure 3.42 | Relative space–time root-mean-square deviation (RMSD) calculated from the climatological seasonal cycle of the CMIP simulations (1980–1999) compared to observational datasets. (a) CMIP3, CMIP5, and CMIP6 for 16 atmospheric variables (b) CMIP5 and CMIP6 for 10 land variables and four ocean/sea-ice variables. A relative performance measure is displayed, with blue shading indicating better and red shading indicating worse performance than the median of all model results. A diagonal split of a grid square shows the relative error with respect to the reference data set (lower right triangle) and an additional data set (upper left triangle). Reference/additional datasets are from top to bottom in (a): ERA5/NCEP, GPCP-SG/GHCN, CERES-EBAF, CERES-EBAF, CERES-EBAF, CERES-EBAF, JRA-55/ERA5, ESACCI-SST/HadISST, ERA5/NCEP, ERA5/NCEP, ERA5/NCEP, ERA5/NCEP, ERA5/NCEP, ERA5/NCEP, AIRS/ERA5, ERA5/NCEP and in (b): CERES-EBAF, CERES-EBAF, CERES-EBAF, CERES-EBAF, LandFlux-EVAL, Landschuetzer2016/ JMA-TRANSCOM; MTE/FLUXCOM, LAI3g, JMA-TRANSCOM, ESACCI-SOILMOISTURE, HadISST/ATSR, HadISST, HadISST, ERA-Interim. White boxes are used when data are not available for a given model and variable. Figure is updated and expanded from Bock et al. (2020), their Figure 5 CC BY 4.0https://creativecommons.org/licenses/by/4.0/. Further details on data sources and processing are available in the chapter data table (Table 3.SM.1).