Back chapter figures
Figure 3.43
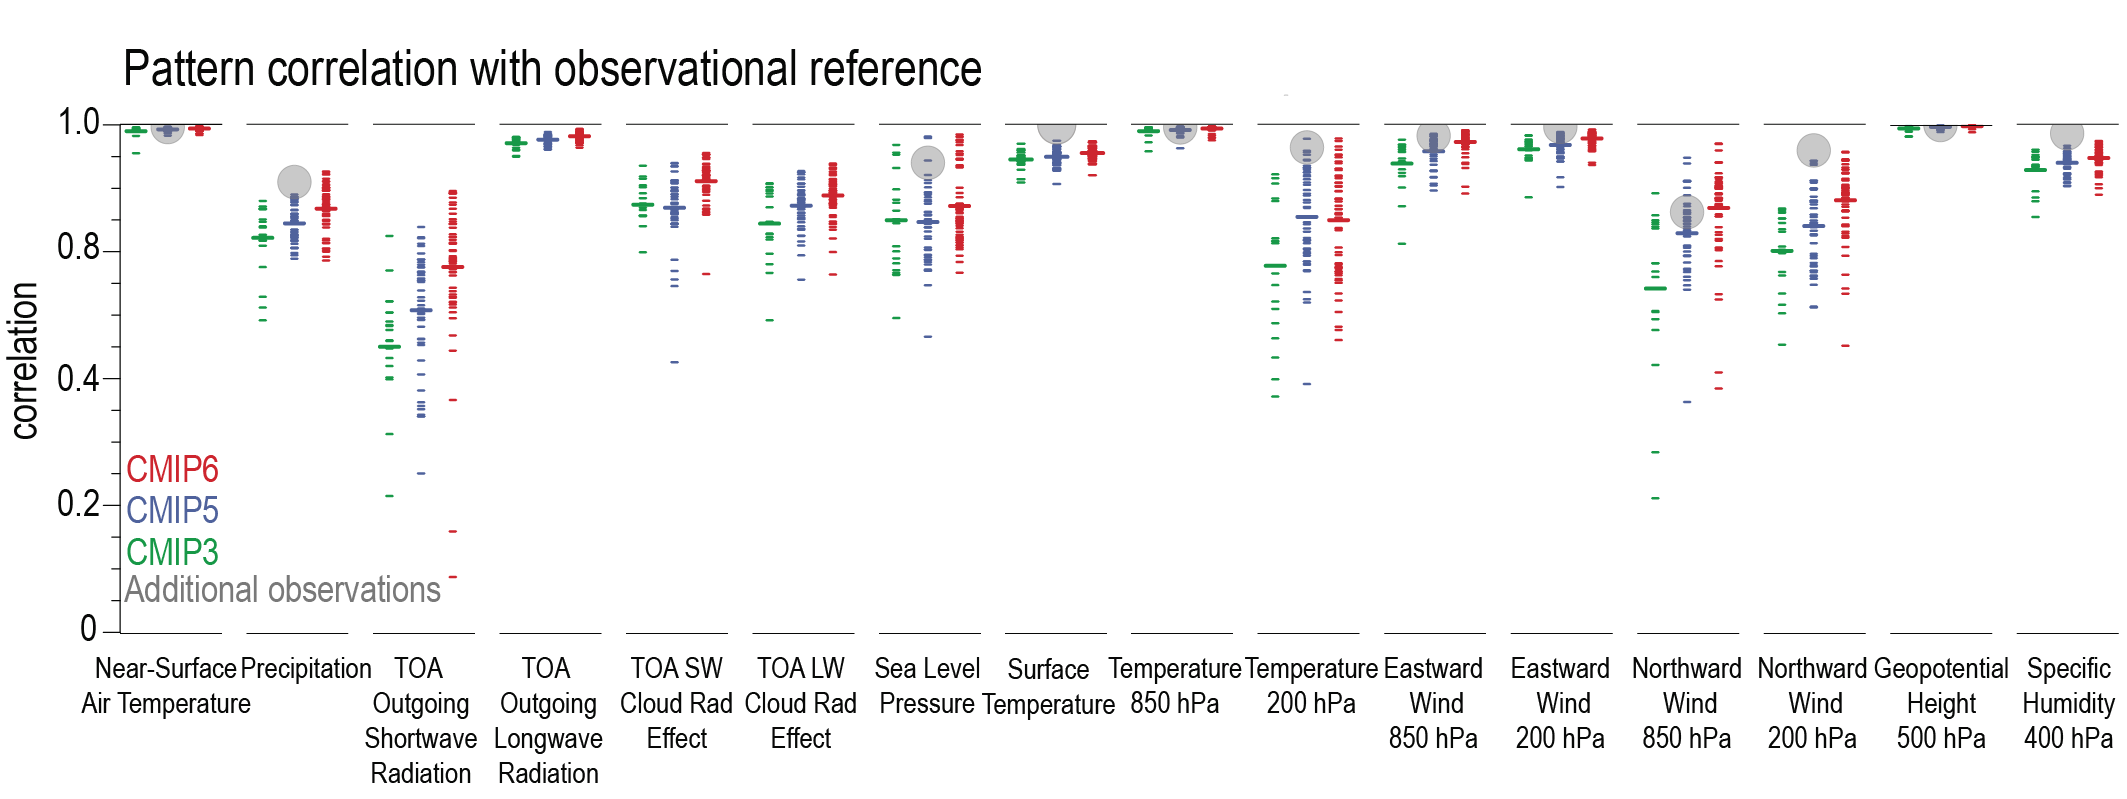
Figure caption
Figure 3.43 | Centred pattern correlations between models and observations for the annual mean climatology over the period 1980–1999. Results are shown for individual CMIP3 (green), CMIP5 (blue) and CMIP6 (red) models (one ensemble member from each model is used) as short lines, along with the corresponding multi-model ensemble averages (long lines). Correlations are shown between the models and the primary reference observational data set (from left to right: ERA5, GPCP-SG, CERES-EBAF, CERES-EBAF, CERES-EBAF, CERES-EBAF, JRA-55, ESACCI-SST, ERA5, ERA5, ERA5, ERA5, ERA5, ERA5, AIRS, ERA5). In addition, the correlation between the primary reference and additional observational datasets (from left to right: NCEP, GHCN, -, -, -, -, ERA5, HadISST, NCEP, NCEP, NCEP, NCEP, NCEP, NCEP, ERA5, NCEP) are shown (solid grey circles) if available. To ensure a fair comparison across a range of model resolutions, the pattern correlations are computed after regridding all datasets to a resolution of 4° in longitude and 5° in latitude. Figure is updated and expanded from Bock et al. (2020), their Figure 7 CC BY 4.0https://creativecommons.org/licenses/by/4.0/. Further details on data sources and processing are available in the chapter data table (Table 3.SM.1).