Back chapter figures
Figure 3.44
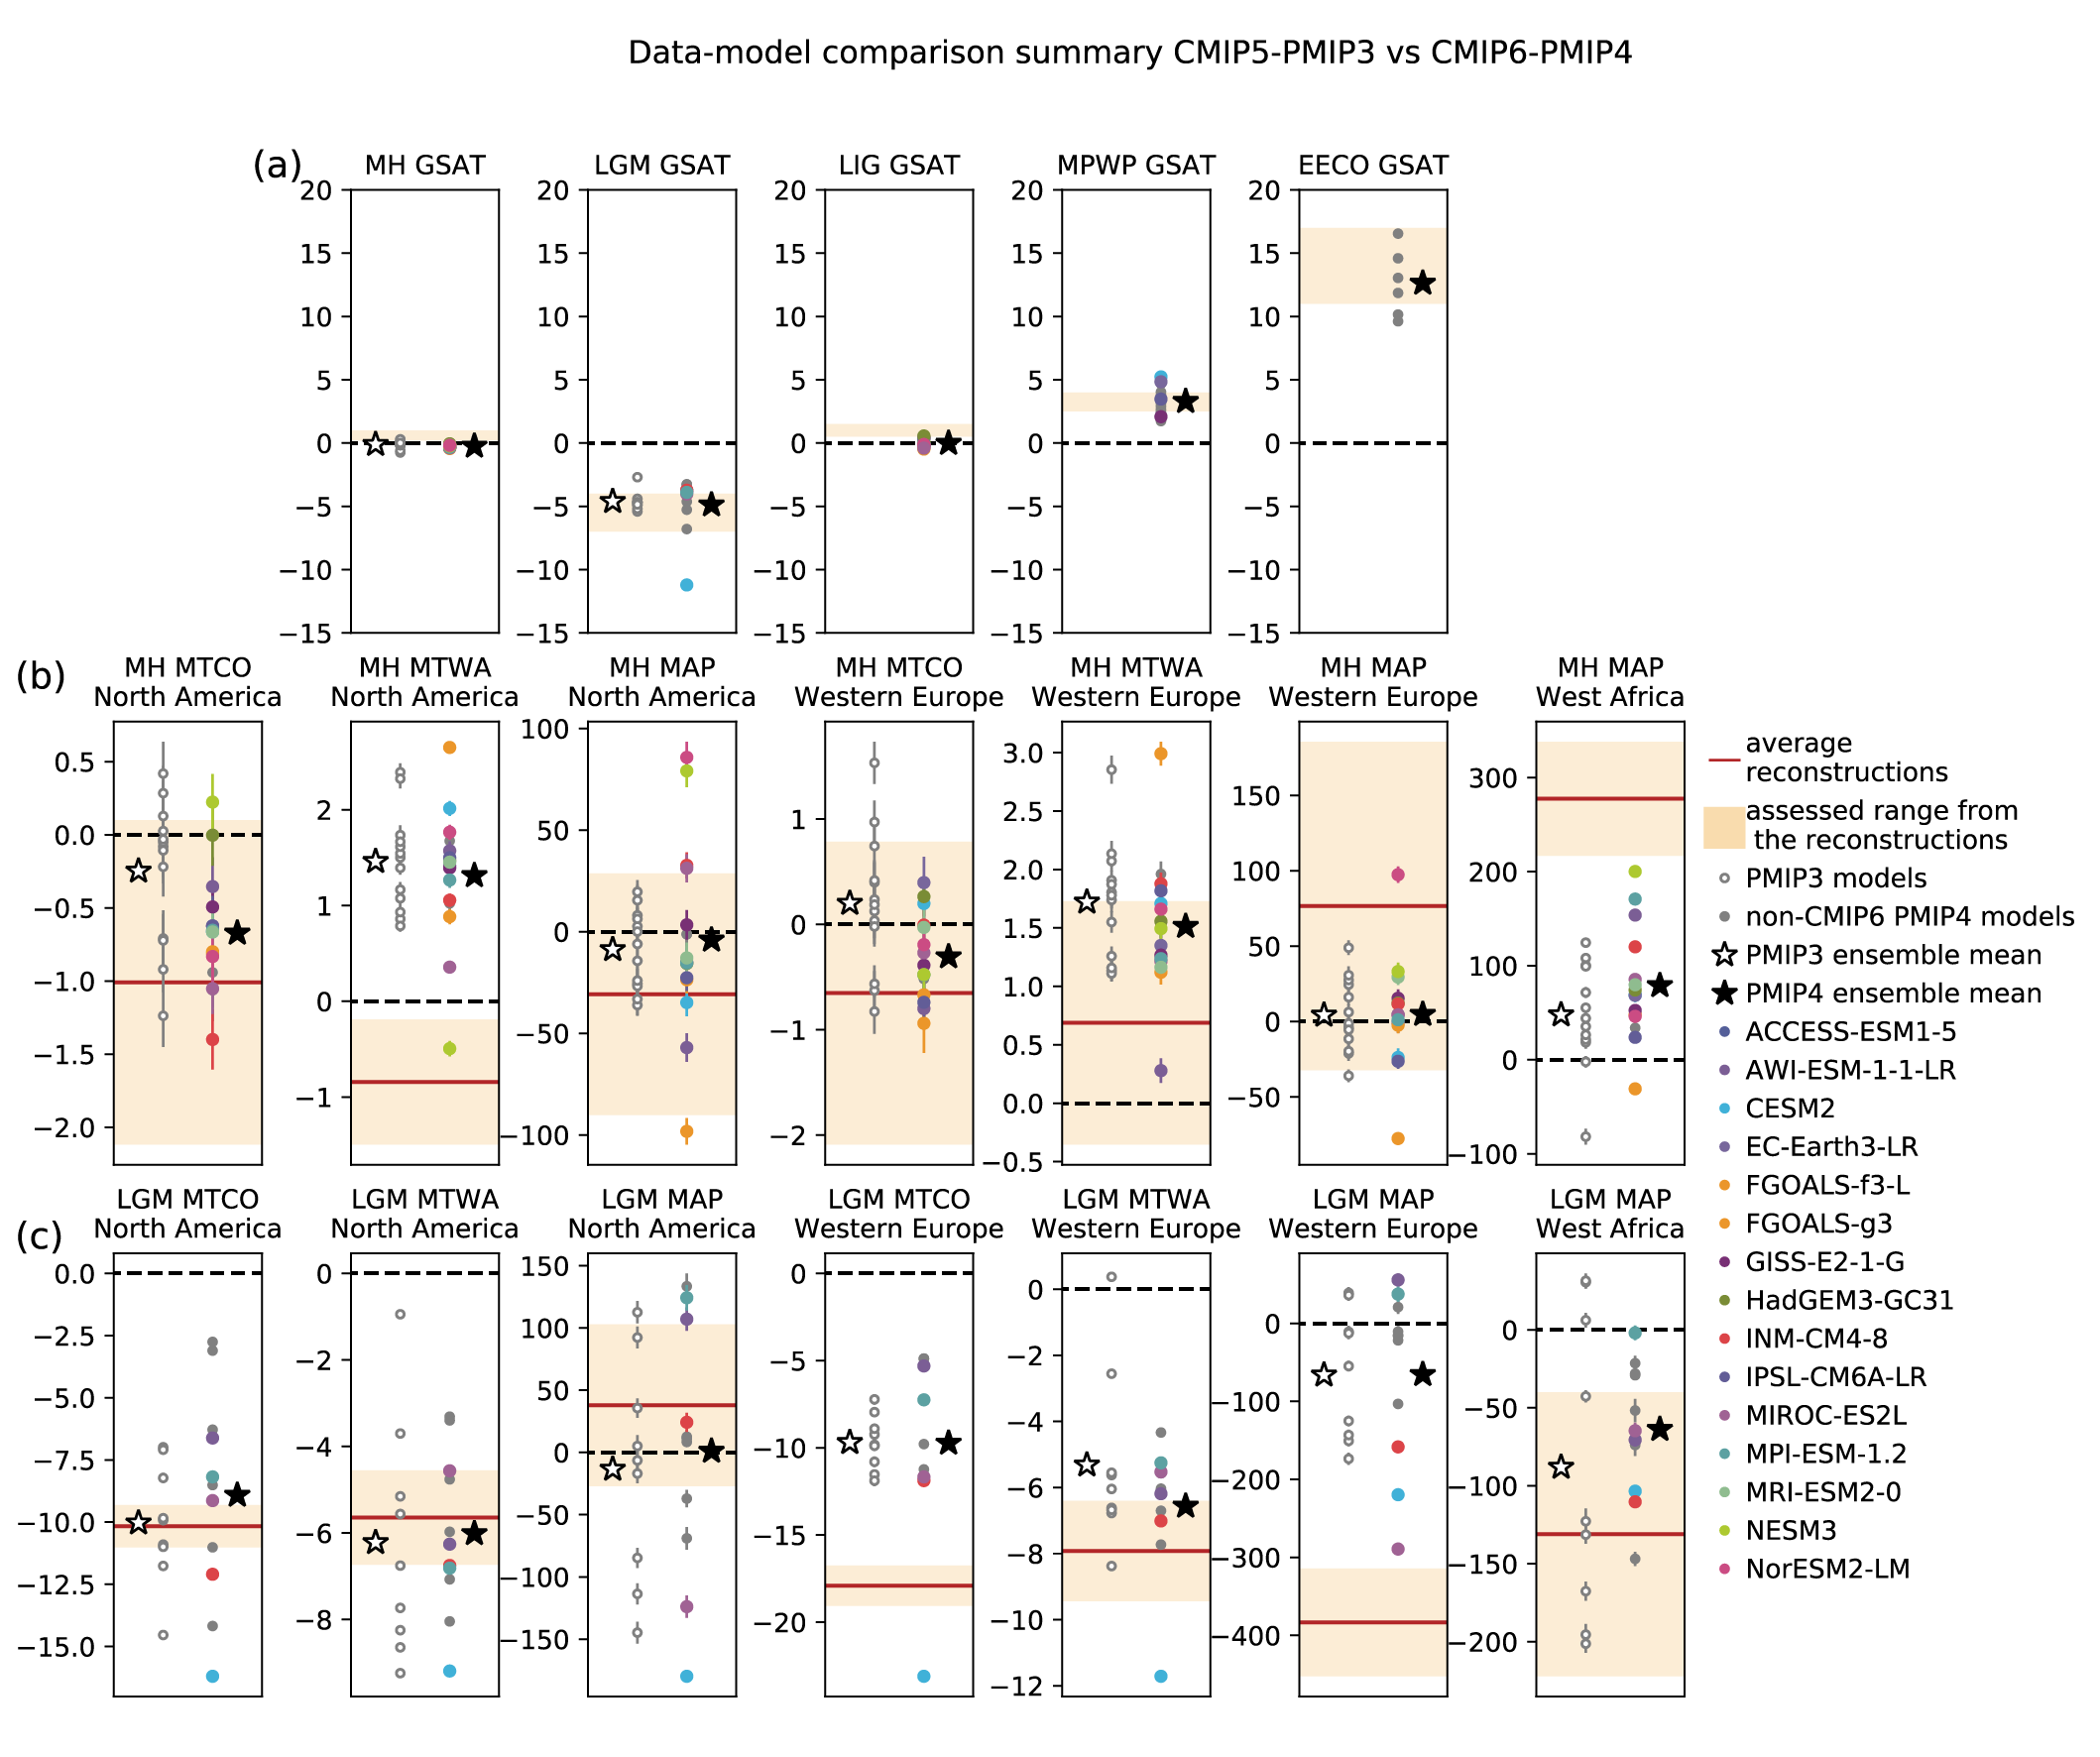
Figure caption
Figure 3.44 | Multivariate synopsis of paleoclimate model results compared to observational references. Data-model comparisons for (a) GSAT anomalies for five PMIP4 periods and for regional features for the (b) mid-Holocene and (c) LGM periods, for PMIP3 and PMIP4 models. The results from CMIP6 models are shown as coloured dots. In (a) the light orange shading shows the very likely assessed ranges presented in Section 2.3.1.1. In (b) and (c), the regions and variables are defined as follows: North America (20°N–50°N, 140°W–60°W), Western Europe (35°N–70°N, 10°W–30°E) and West Africa (0°–30°N, 10°W–30°E); mean temperature of the coldest month (MTCO; °C), mean temperature of the warmest month (MTWA; °C), mean annual precipitation (MAP; mm yr–1). In (b) and (c) the ranges shown for the reconstructions (Bartlein et al. (2011) for mid-Holocene and Cleator et al. (2020) for LGM) are based on the standard error given at each site: the average and associated standard deviation over each area is obtained by computing 1000 times the average of randomly drawn values from the Gaussian distributions defined at each site by the reconstruction mean and standard error; the light orange colour shows the ±1 standard deviation of these 1000 estimates. The dots on (b) and (c) show the average of the model output for grid points for which there are reconstructions. The ranges for the model results are based on an ensemble of 1000 averages over 50 years randomly picked in the model output time series for each region and each variable: the mean ± one standard deviation is plotted for each model. Figure is adapted from Brierley et al. (2020), their Figure S3 for the mid-Holocene; and from Kageyama et al. (2021b), their Figure 12 for the LGM. Further details on data sources and processing are available in the chapter data table (Table 3.SM.1).