Back chapter figures
Figure 3.5
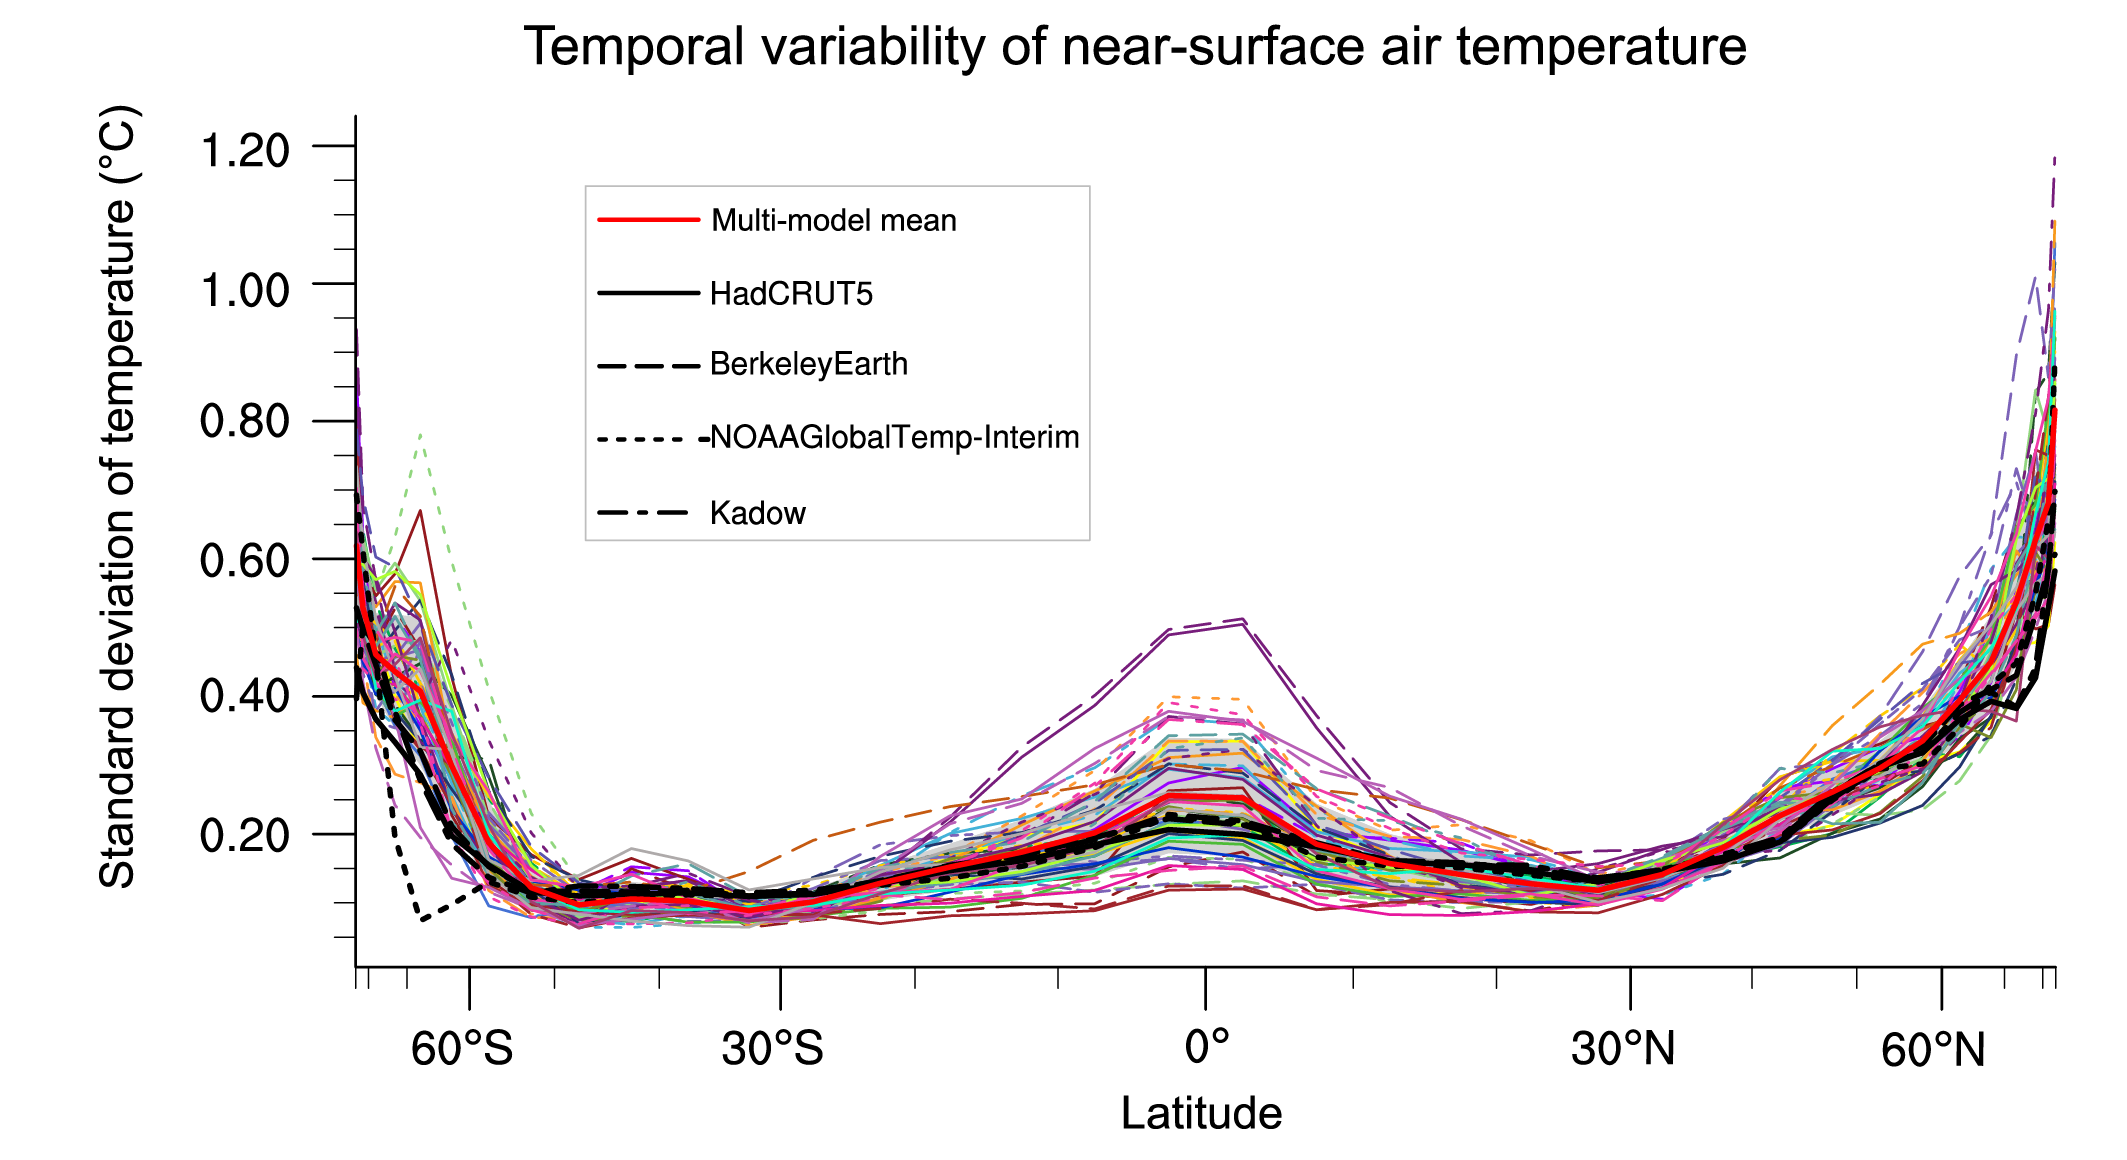
Figure caption
Figure 3.5 | The standard deviation of annually averaged zonal-mean near-surface air temperature. This is shown for four detrended observed temperature datasets (HadCRUT5, Berkeley Earth, NOAAGlobalTemp-Interim and Kadow et al. (2020), for the years 1995-2014) and 59 CMIP6 pre-industrial control simulations (one ensemble member per model, 65 years) (after Jones et al., 2013). For line colours see the legend of Figure 3.4. Additionally, the multi-model mean (red) and standard deviation (grey shading) are shown. Observational and model datasets were detrended by removing the least-squares quadratic trend. Further details on data sources and processing are available in the chapter data table (Table 3.SM.1).