Back chapter figures
Figure 3.7
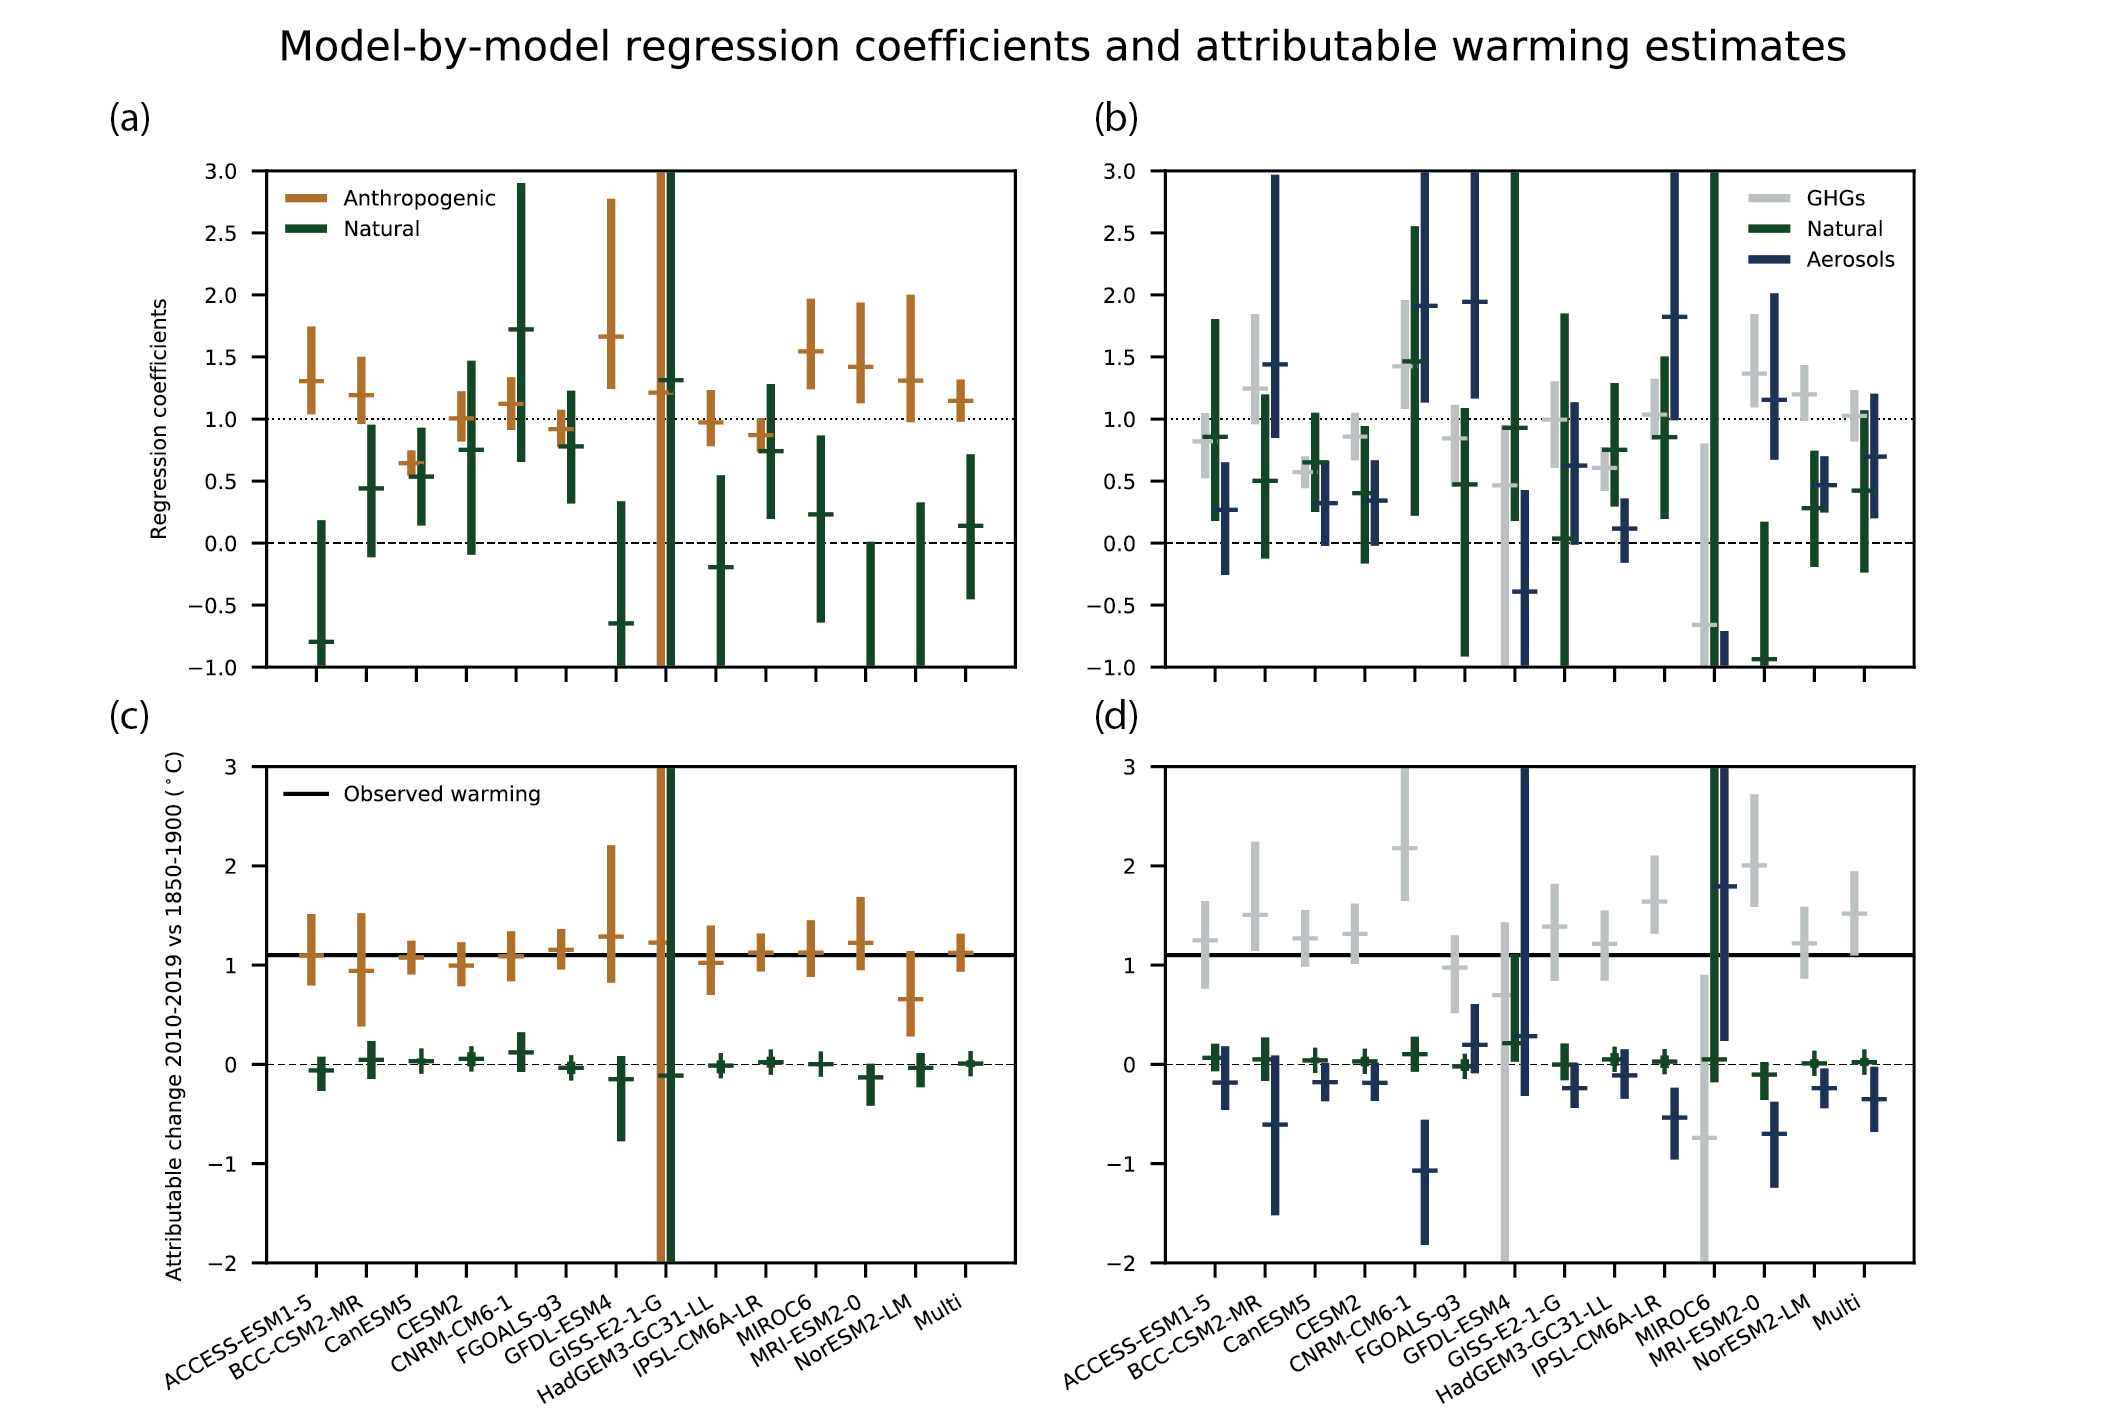
Figure caption
Figure 3.7 | Regression coefficients and corresponding attributable warming estimates for individual CMIP6 models. Upper panels show regression coefficients based on a two-way regression (left) and three-way regression (right), of observed five-year mean, globally averaged, masked and blended surface temperature (HadCRUT4) onto individual model response patterns, and a multi-model mean, labelled ‘Multi’. Anthropogenic, natural, greenhouse gas, and other anthropogenic (aerosols, ozone, land-use change) regression coefficients are shown. Regression coefficients are the scaling factors by which the model responses must be multiplied to best match observations. Regression coefficients consistent with one indicate a consistent magnitude response in observations and models, and regression coefficients significantly greater than zero indicate a detectable response to the forcing concerned. Lower panels show corresponding observationally-constrained estimates of attributable warming in globally-complete GSAT for the period 2010–2019, relative to 1850–1900, and the horizontal black line shows an estimate of observed warming in GSAT for this period. Figure is adapted from Gillett et al. (2021), their Extended Data Figure 3. Further details on data sources and processing are available in the chapter data table (Table 3.SM.1).