Back chapter figures
Figure 3.8
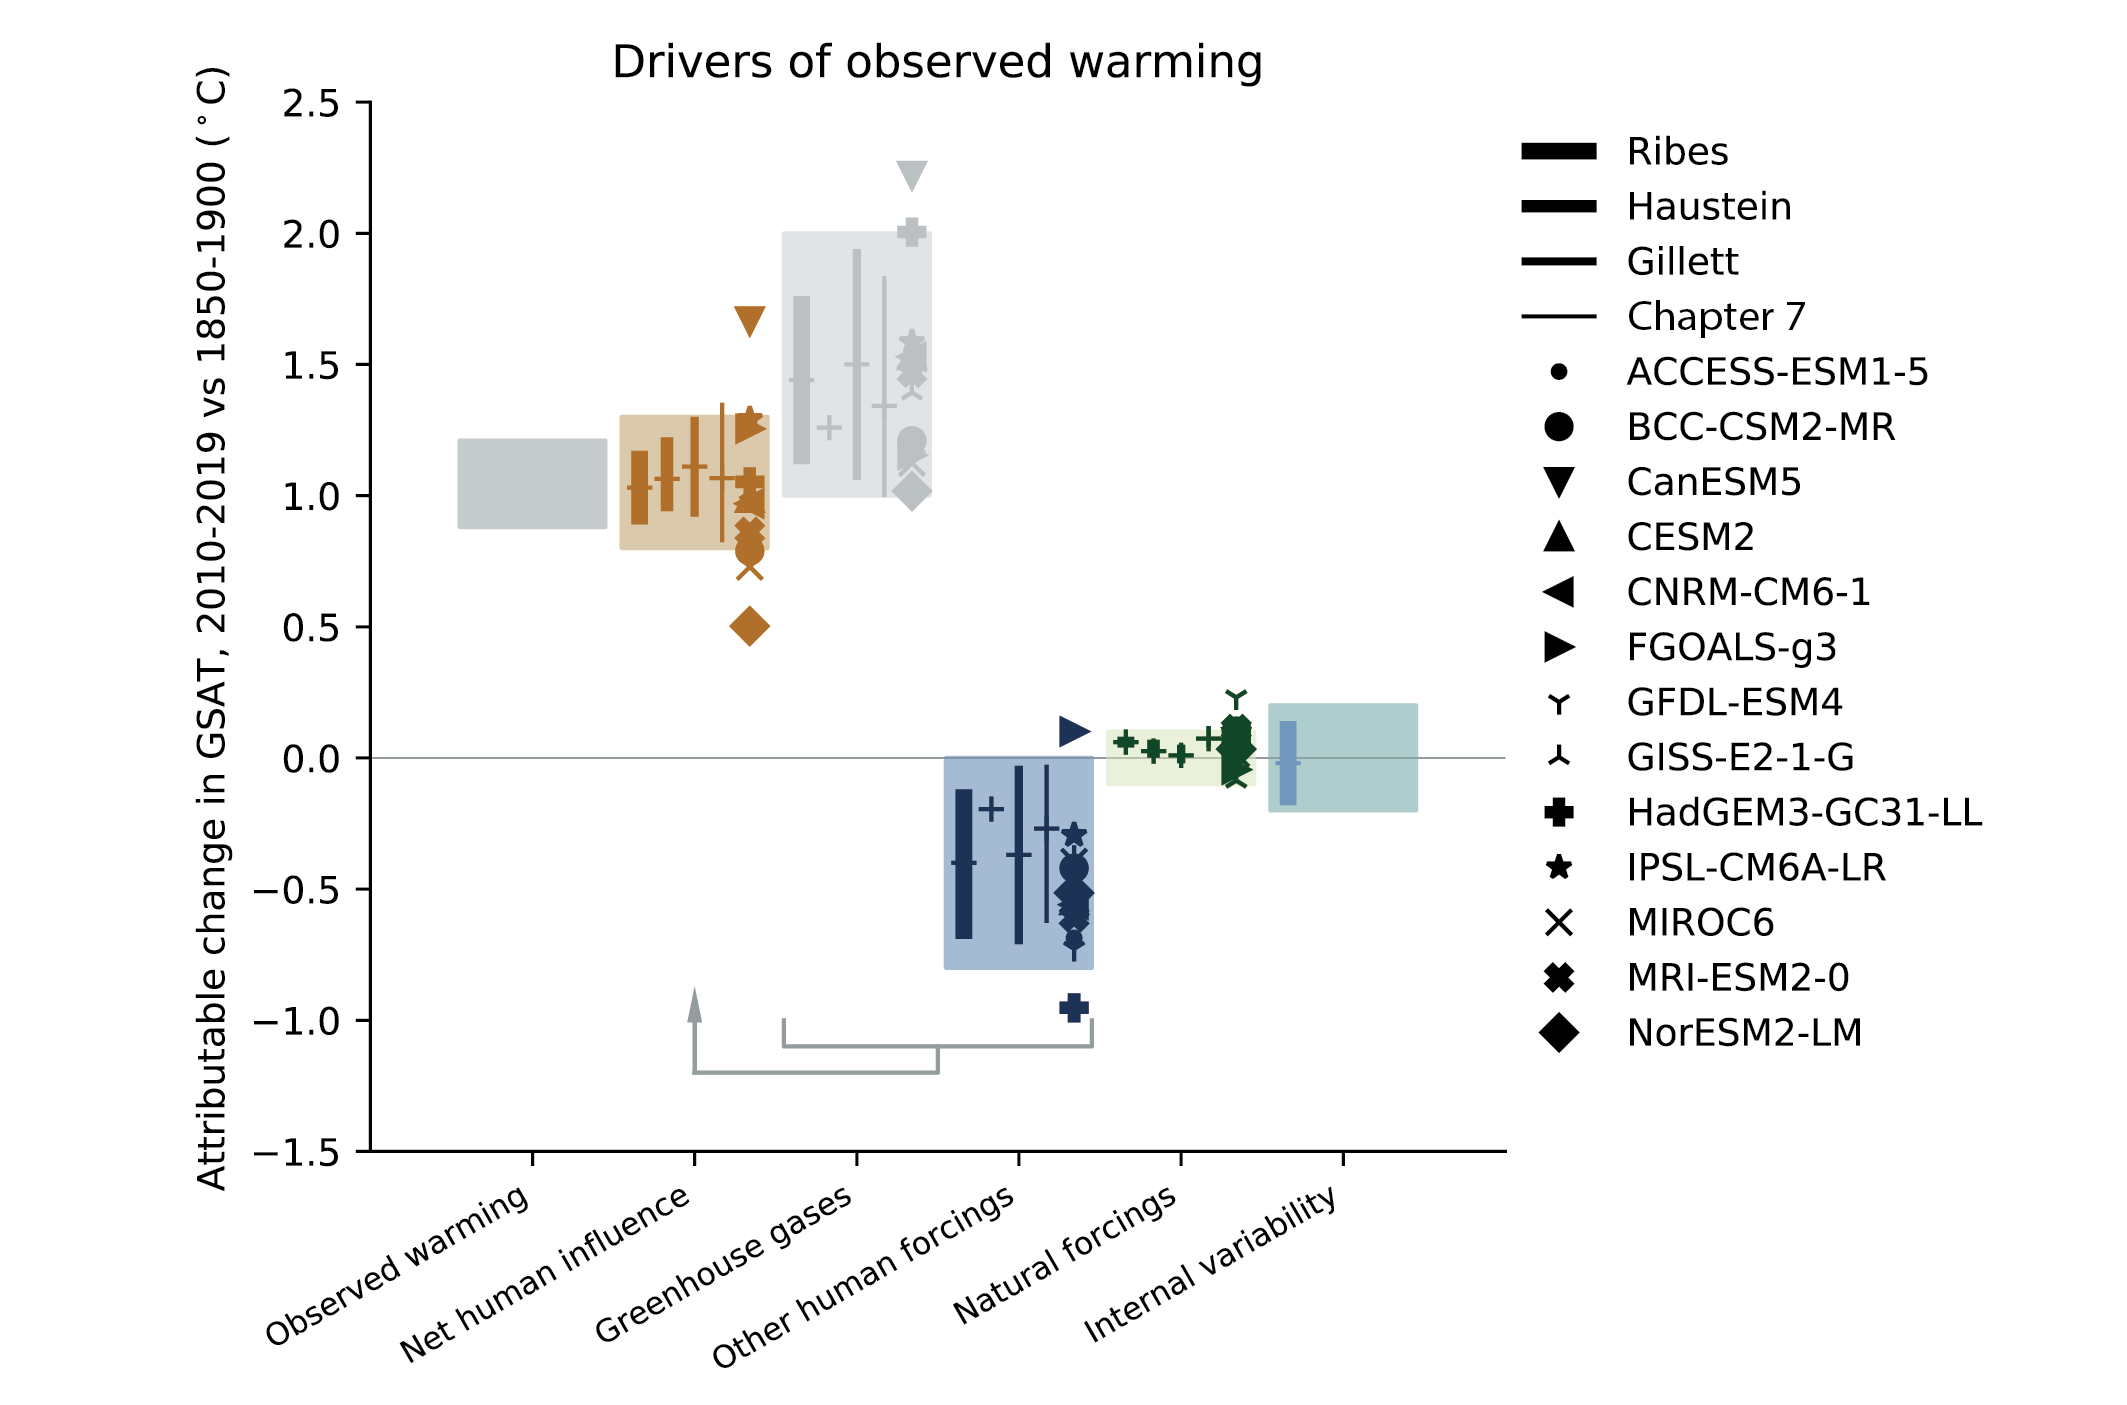
Figure caption
Figure 3.8 | Assessed contributions to observed warming, and supporting lines of evidence. Shaded bands show assessed likely ranges of temperature change in GSAT, 2010–2019 relative to 1850–1900, attributable to net human influence, well-mixed greenhouse gases, other human forcings (aerosols, ozone, and land-use change), natural forcings, and internal variability, and the 5–95% range of observed warming. Bars show 5–95% ranges based on (left to right) Haustein et al. (2017), Gillett et al. (2021) and Ribes et al. (2021), and crosses show the associated best estimates. No 5–95% ranges were provided for the Haustein et al. (2017) greenhouse gas or other human forcings contributions. The Ribes et al. (2021) results were updated using a revised natural forcing time series, and the Haustein et al. (2017) results were updated using HadCRUT5. The Chapter 7 best estimates and ranges were derived using assessed forcing time series and a two-layer energy balance model as described in Section 7.3.5.3. Coloured symbols show the simulated responses to the forcings concerned in each of the models indicated. Further details on data sources and processing are available in the chapter data table (Table 3.SM.1).