Back chapter figures
Figure 3.9
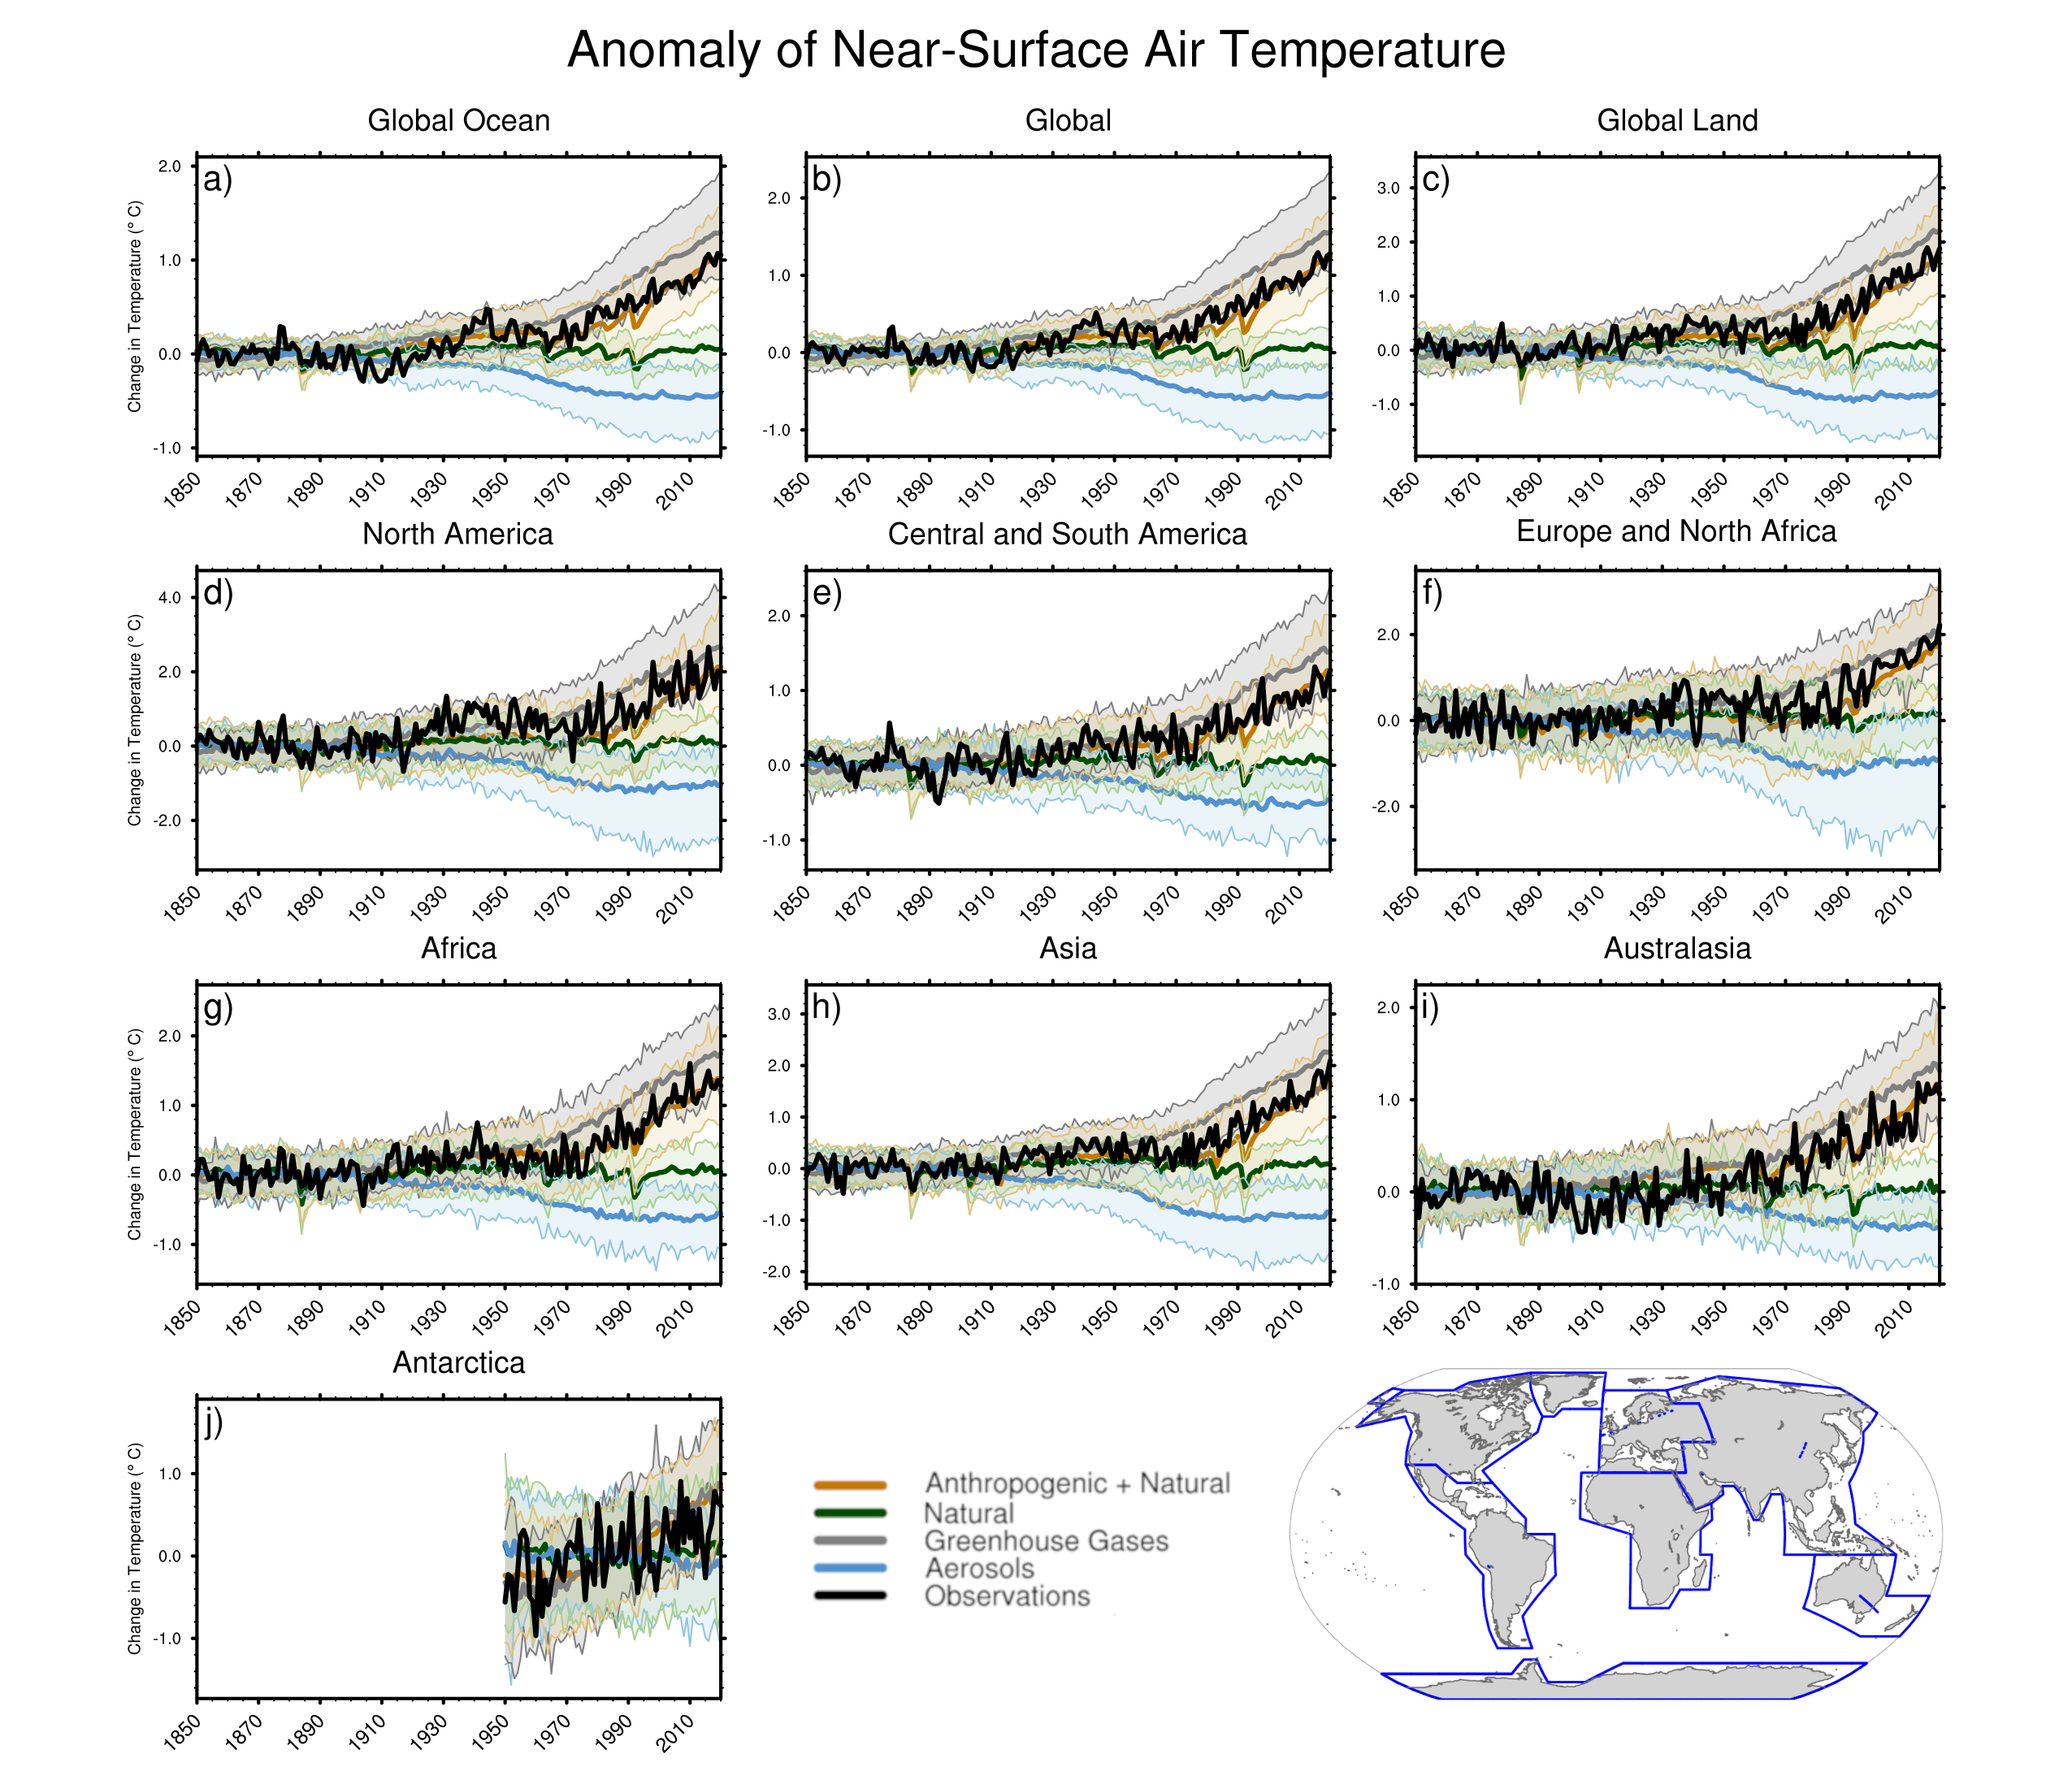
Figure caption
Figure 3.9 | Global, land, ocean and continental annual mean near-surface air temperatures anomalies in CMIP6 models and observations. Time series are shown for CMIP6 historical anthropogenic and natural (brown), natural-only (green), greenhouse gas only (grey) and aerosol only (blue) simulations (thick lines show multi-model means and shaded regions show the 5th to 95th percentile ranges) and for HadCRUT5 (black). All models have been subsampled using the HadCRUT5 observational data mask. Temperature anomalies are shown relative to 1950–2010 for Antarctica and relative to 1850–1900 for other continents. CMIP6 historical simulations are extended using the SSP2-4.5 scenario simulations. All available ensemble members were used (see Section 3.2). Regions are defined by Iturbide et al. (2020). Further details on data sources and processing are available in the chapter data table (Table 3.SM.1).