Back chapter figures
FAQ 4.3, Figure 1
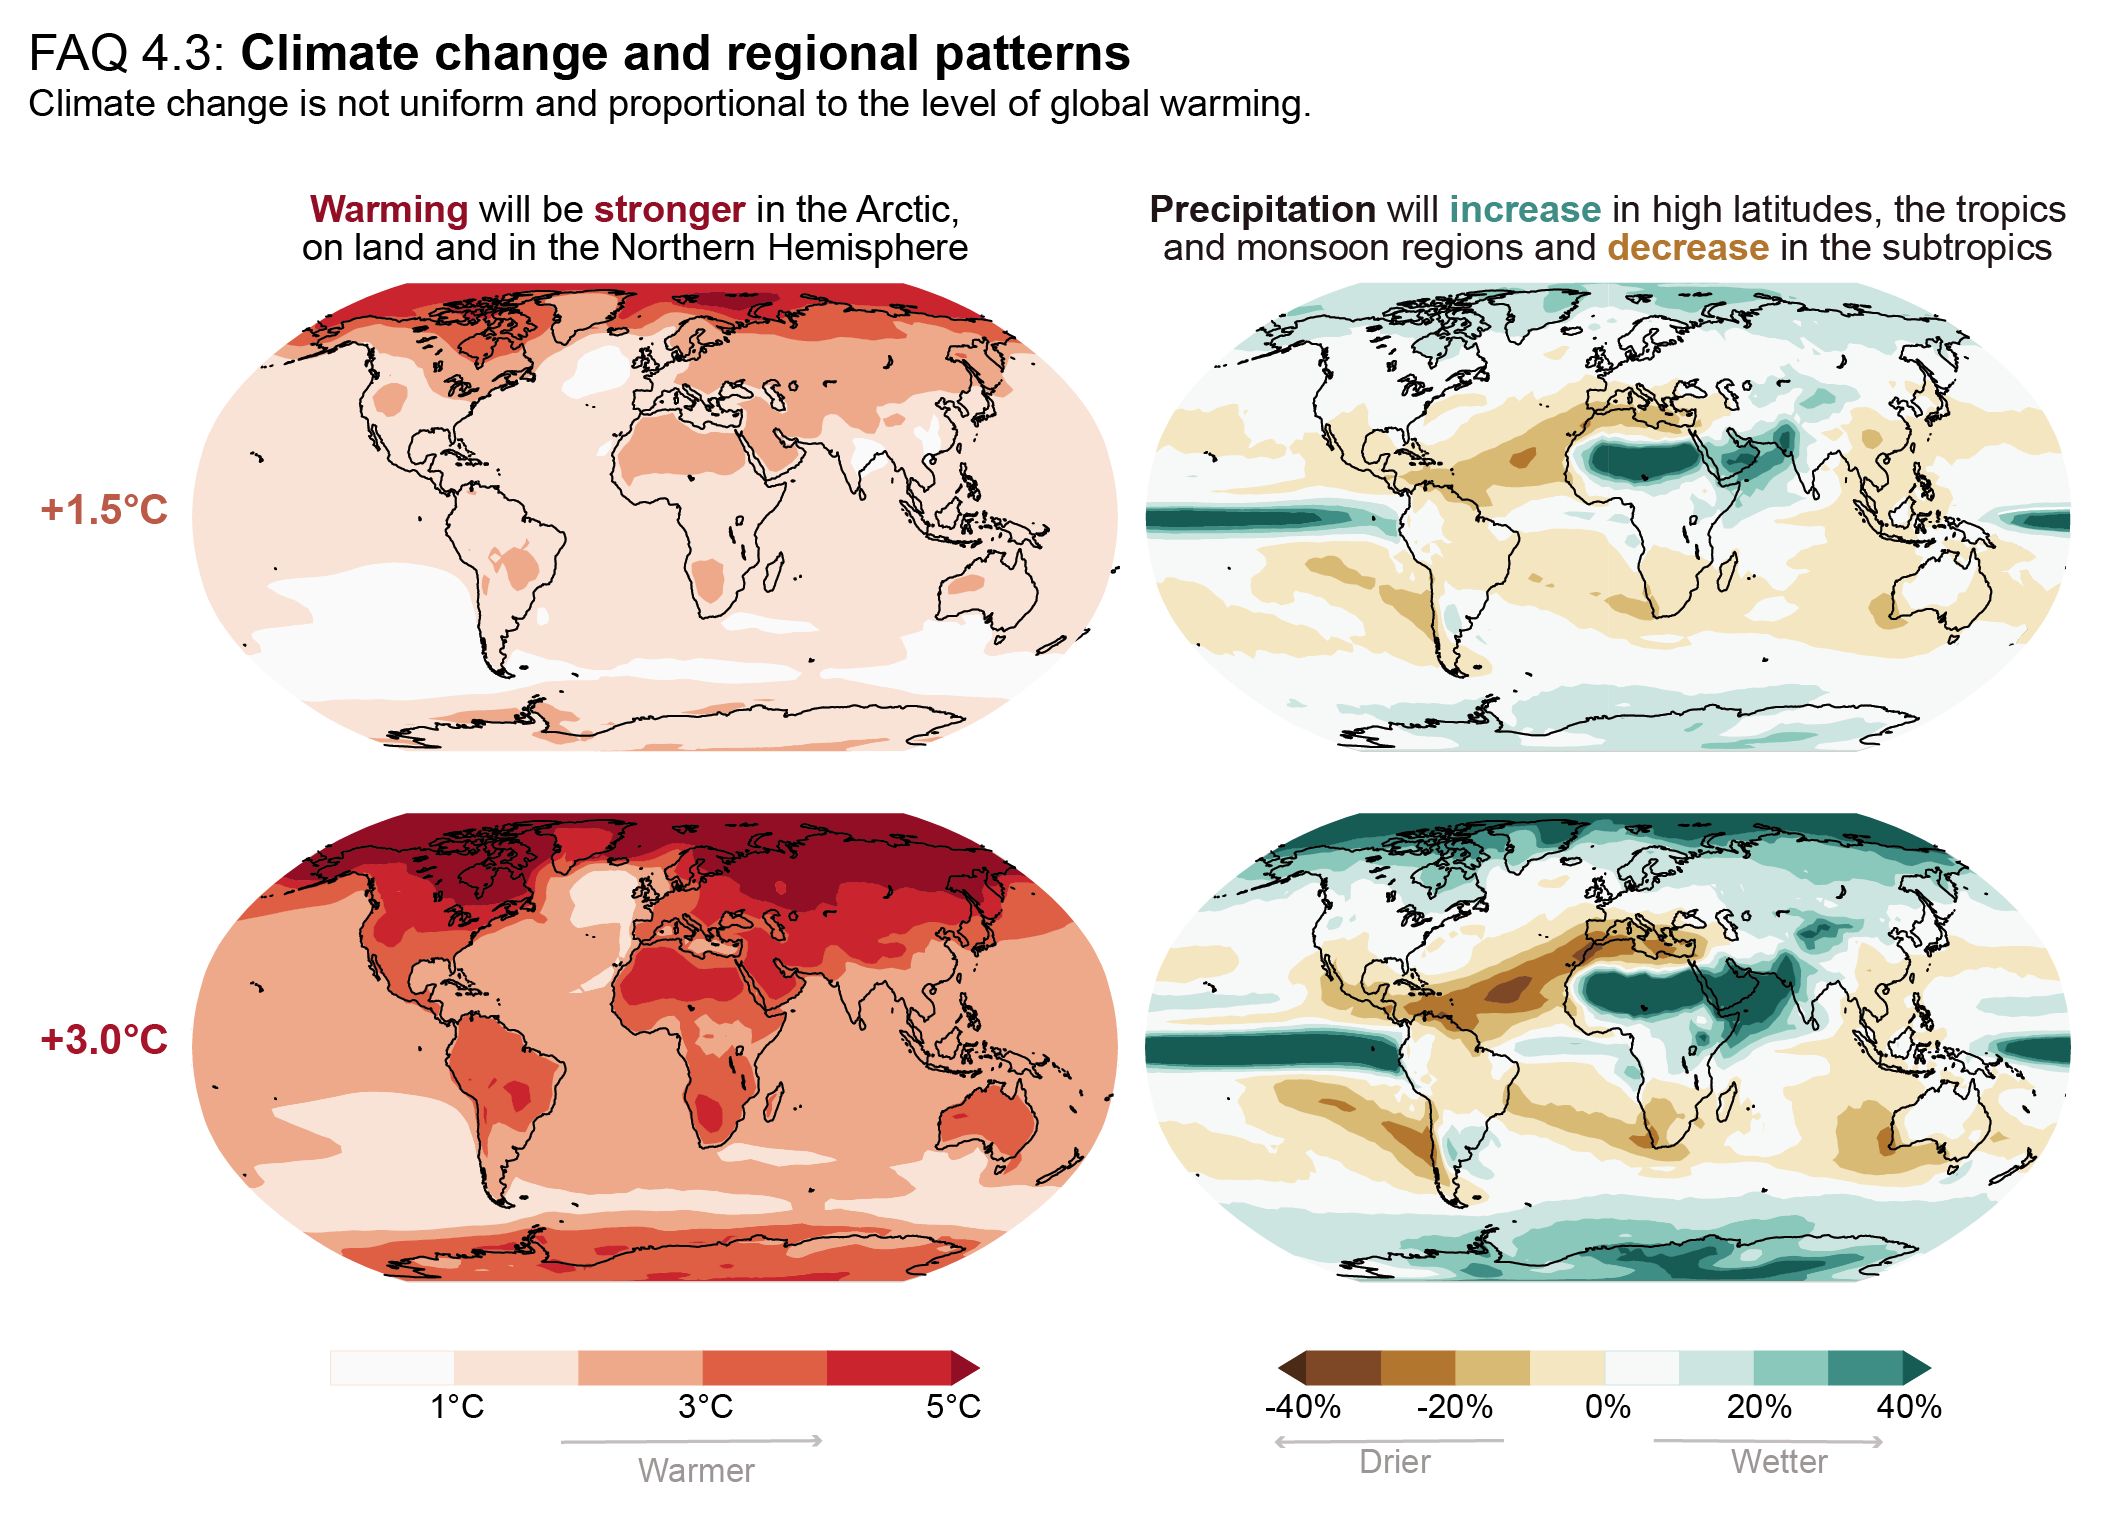
Figure caption
FAQ 4.3, Figure 1 | Regional changes in temperature (left) and precipitation (right) are proportional to the level of global warming, irrespective of the scenario through which the level of global warming is reached. Surface warming and precipitation change are shown relative to the 1850–1900 climate, and for time periods over which the globally averaged surface warming is 1.5°C (top) and 3°C (bottom), respectively. Changes presented here are based on 31 CMIP6 models using the high-emissions scenario SSP3-7.0.