Back chapter figures
Figure 4.15
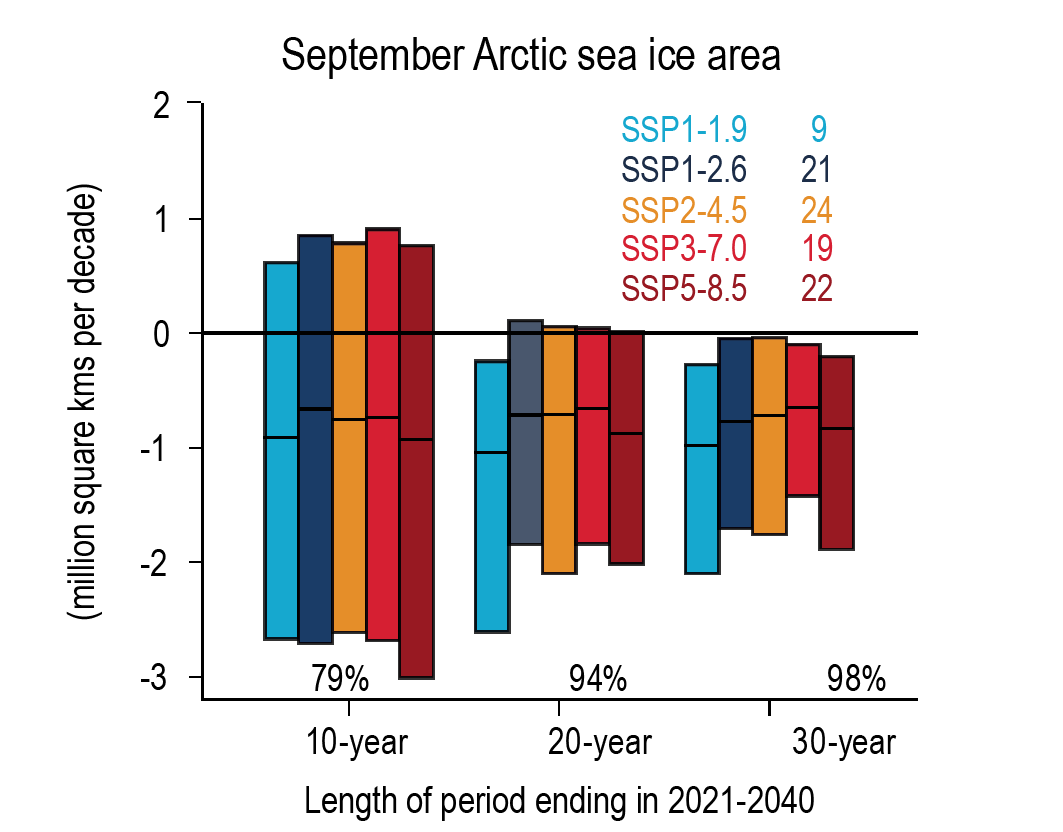
Figure caption
Figure 4.15 | CMIP6 linear trends in September Arctic sea-ice area for 10-year, 20-year, and 30-year periods ending in 2021–2040 following five SSPs. Plotted are the 5–95% ranges across the ensembles of simulations. The numbers at the top of the plot are the number of model simulations in each SSP ensemble. The numbers near the bottom of the plot indicate the percentage of simulations across all the SSPs with decreasing sea-ice area. Results are from concentration-driven simulations. Further details on data sources and processing are available in the chapter data table (Table 4.SM.1).