Back chapter figures
Figure 4.16
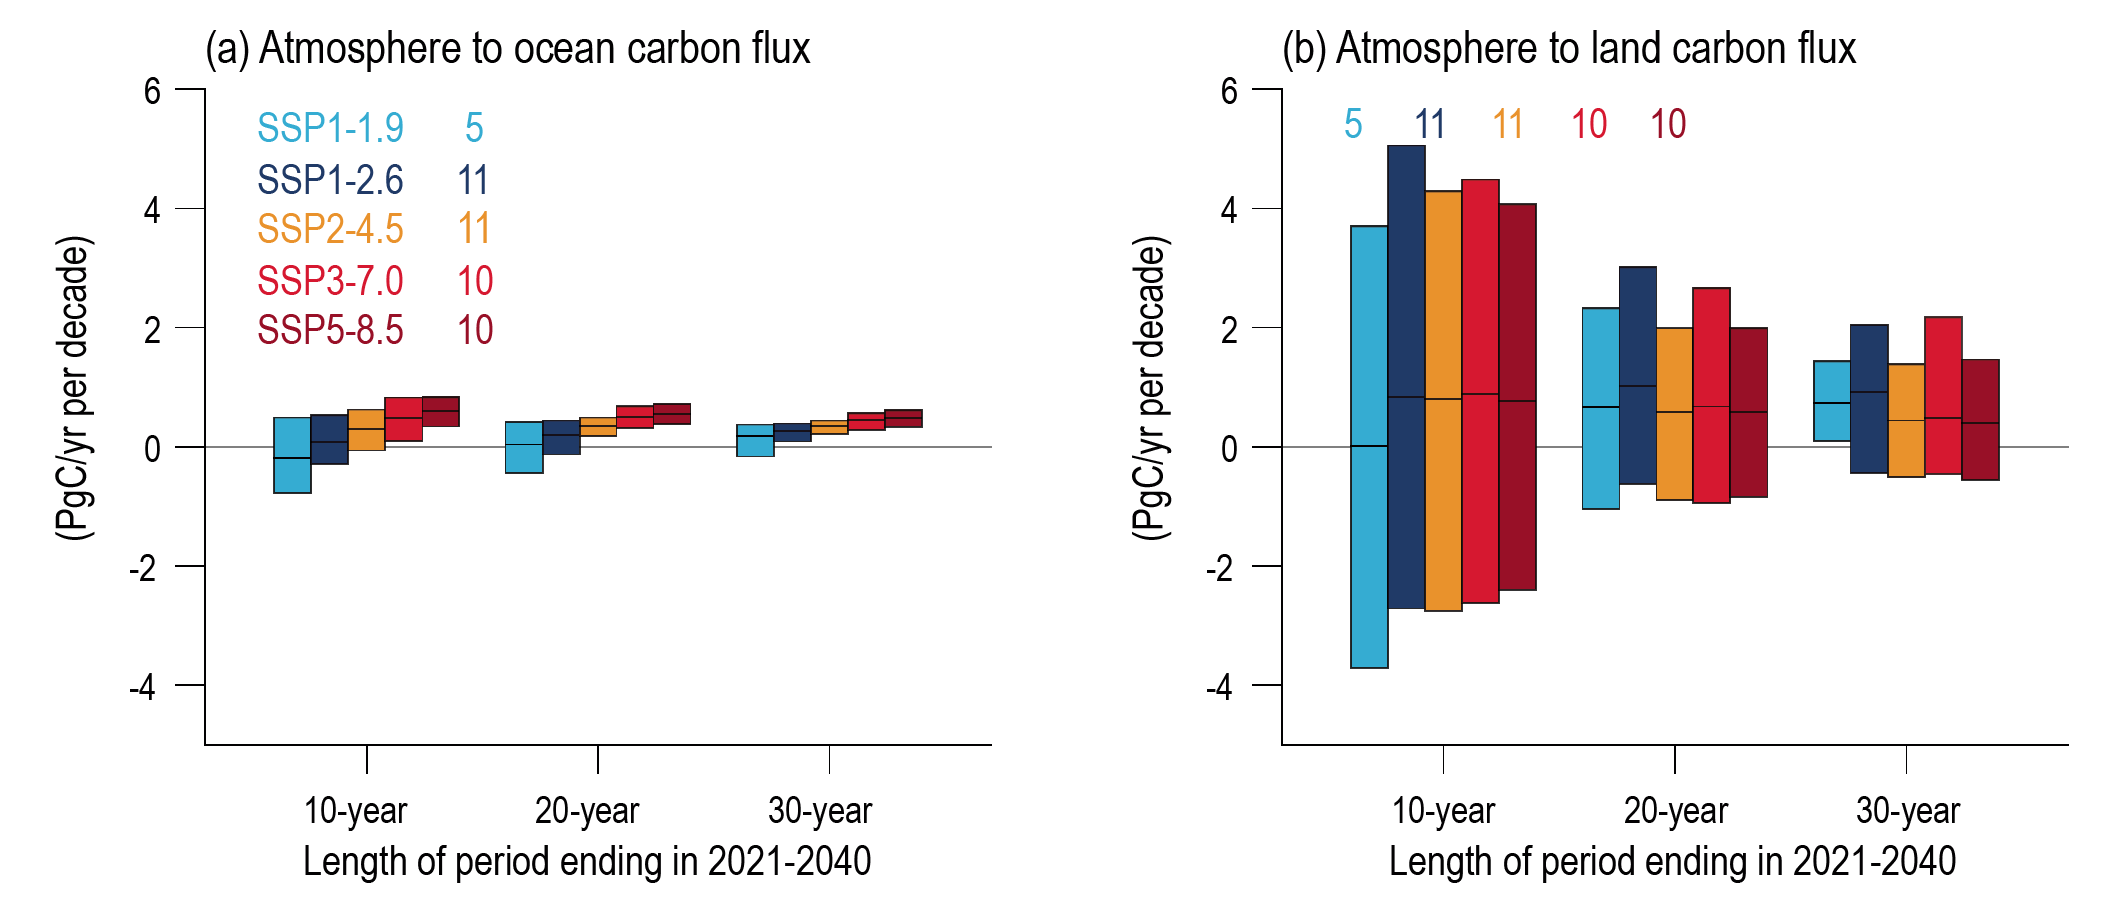
Figure caption
Figure 4.16 | CMIP6 trends in ocean and land carbon flux for 10-year, 20-year, and 30-year periods ending in 2021–2040. (a) Ocean carbon flux. (b) Land carbon flux. Plotted are the 5–95% ranges across the ensembles of simulations, for five SSPs. The numbers at the top of the plots are the number of model simulations in each SSP ensemble. Units are PgC yr–1 per decade. Further details on data sources and processing are available in the chapter data table (Table 4.SM.1).