Back chapter figures
Figure 4.18
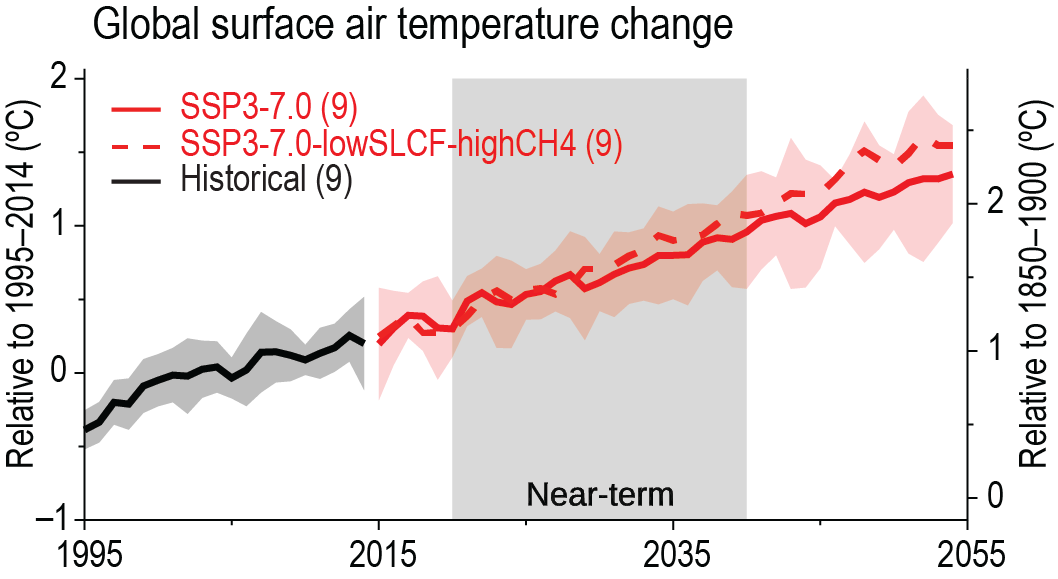
Figure caption
Figure 4.18 | Influence of SLCFs on projected GSAT change. Change is shown relative to the 1995–2014 average (left axis) and relative to the 1850–1900 average (right axis). The comparison is for CMIP6 models for the AerChemMIP (Collins et al., 2017) SSP3-7.0-lowSLCF-highCH4 experiment (red dashed; note in the original experiment protocol this is called SSP3-7.0-lowNTCF), where concentrations of short-lived species are reduced compared to reference SSP3-7.0 scenario (red solid). Black shows the historical simulation until 2014 for the same 9 models as the projections. The curves show averages over the r1 simulations contributed to the CMIP6 exercise, the shadings around the historical and SSP3-7.0 curves shows 5–95% ranges and the numbers near the top show the number of model simulations.