Back chapter figures
Figure 4.19
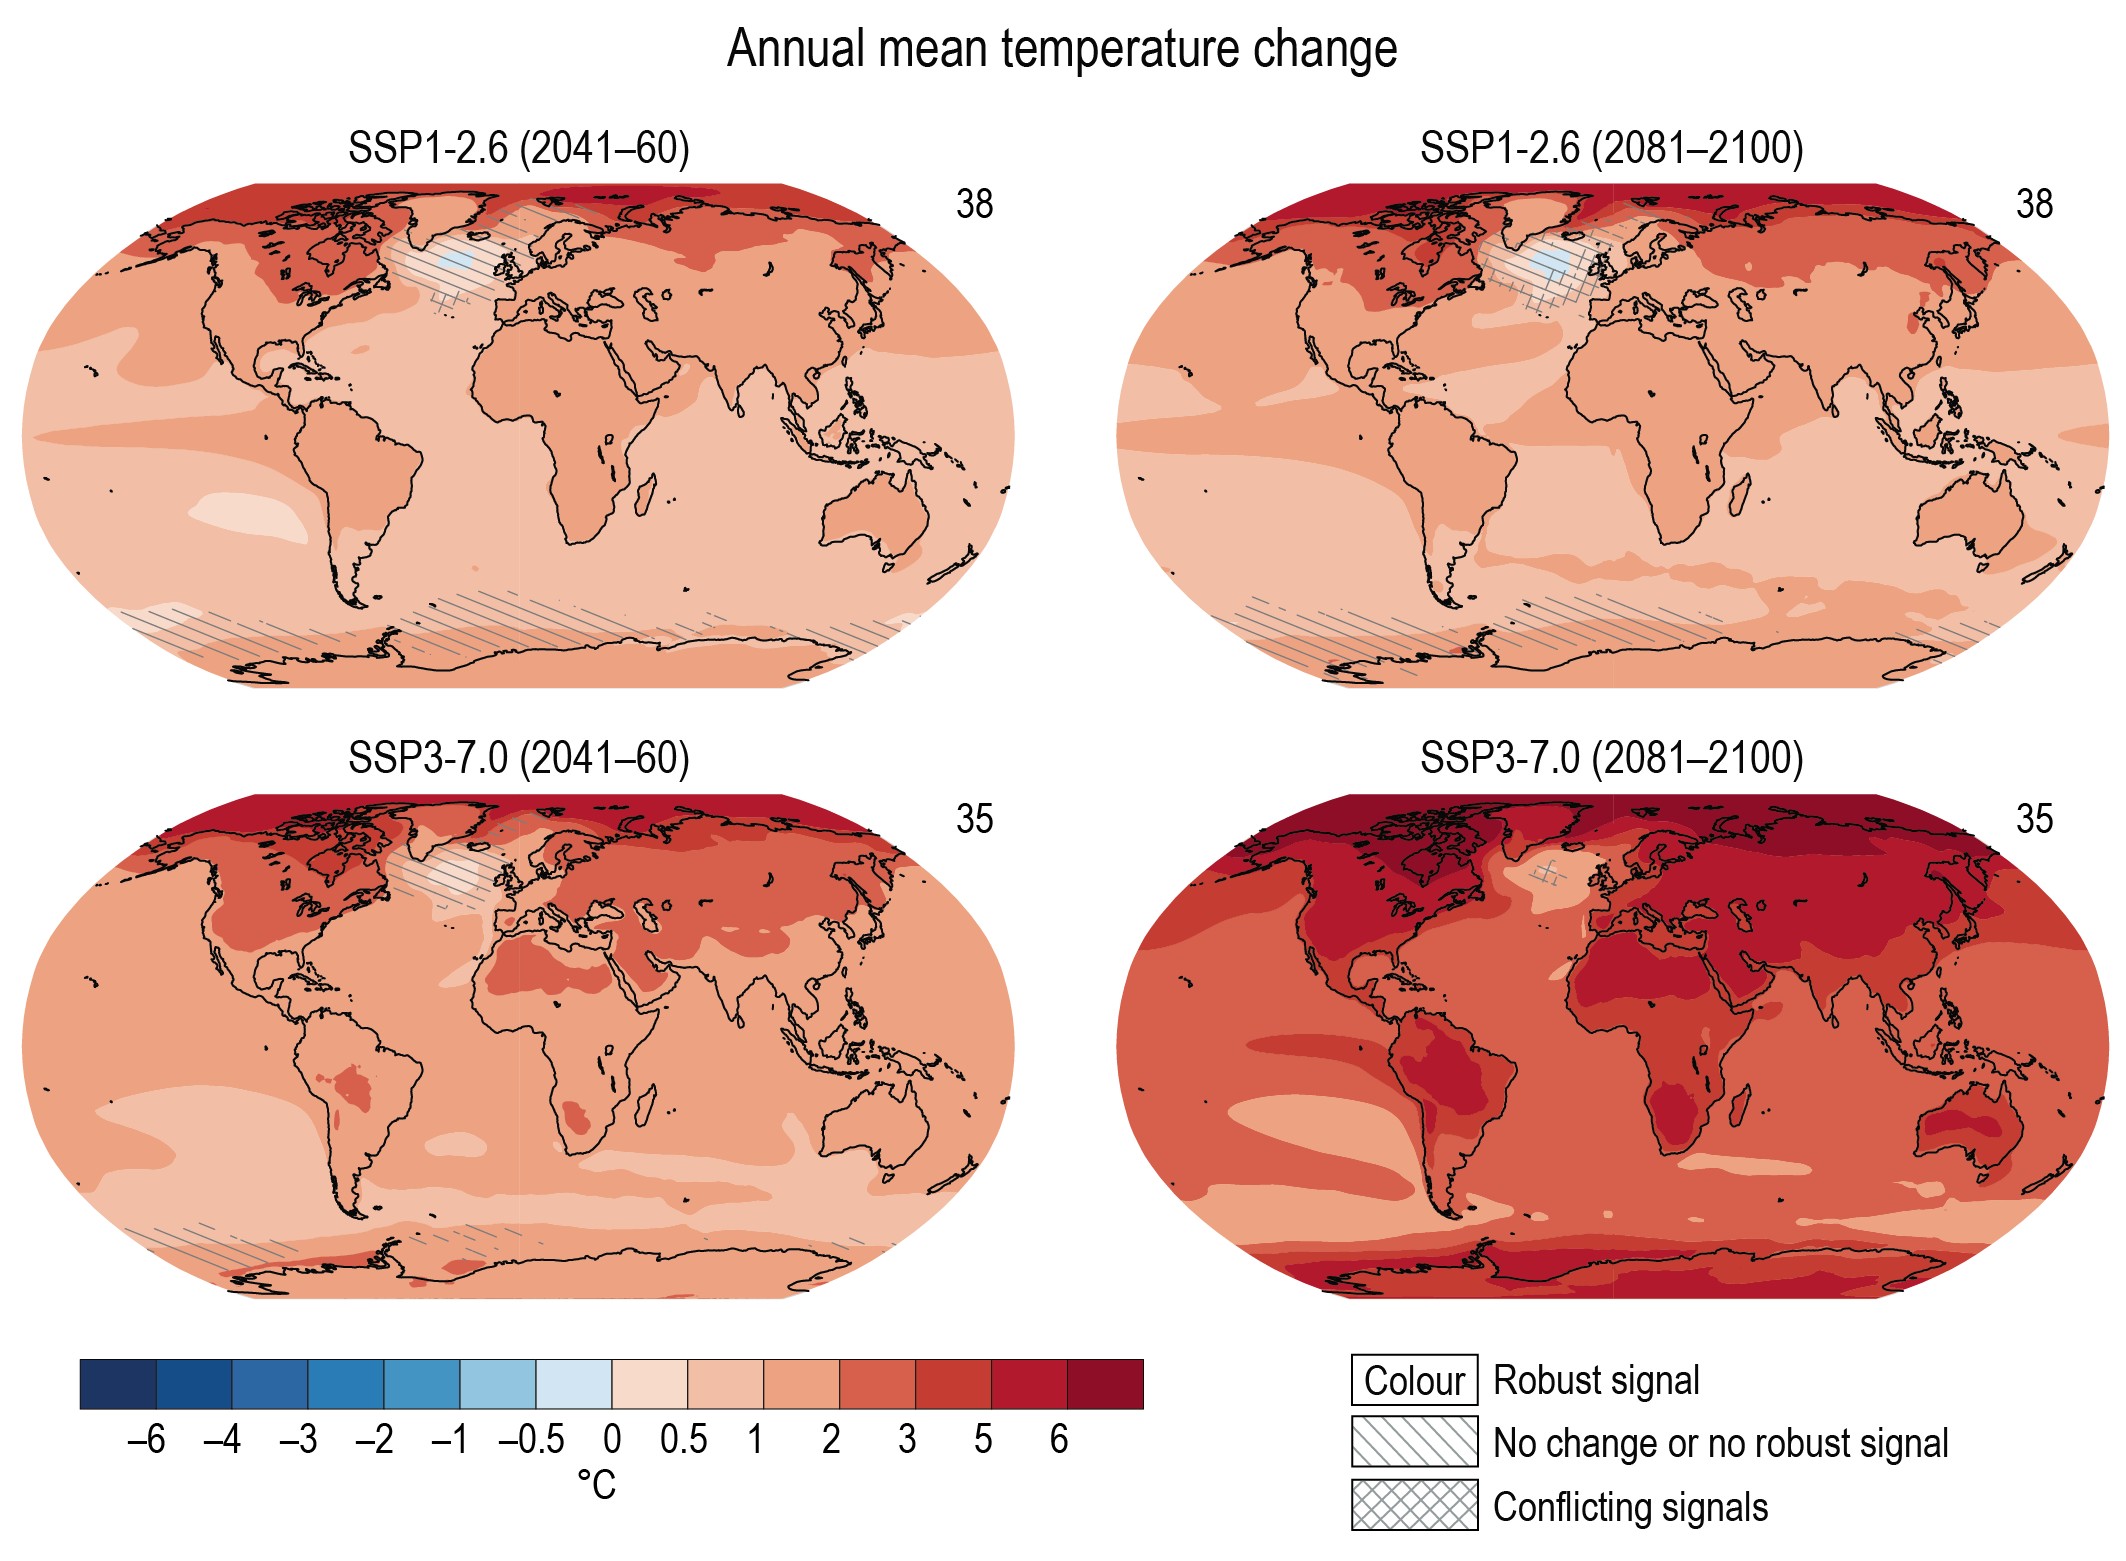
Figure caption
Figure 4.19 | Mid-and long-term change of annual mean surface temperature. Displayed are projected spatial patterns of multi-model mean change in annual mean near-surface air temperature (°C) in 2041–2060 and 2081–2100 relative to 1995–2014 for (top) SSP1-2.6 and (bottom) SSP3-7.0. The number of models used is indicated in the top right of the maps. No overlay indicates regions where the change is robust and likely emerges from internal variability, that is, where at least 66% of the models show a change greater than the internal-variability threshold (see Section 4.2.6) and at least 80% of the models agree on the sign of change. Diagonal lines indicate regions with no change or no robust significant change, where fewer than 66% of the models show change greater than the internal-variability threshold. Crossed lines indicate areas of conflicting signals where at least 66% of the models show change greater than the internal-variability threshold but fewer than 80% of all models agree on the sign of change. Further details on data sources and processing are available in the chapter data table (Table 4.SM.1).