Back chapter figures
Figure 4.2
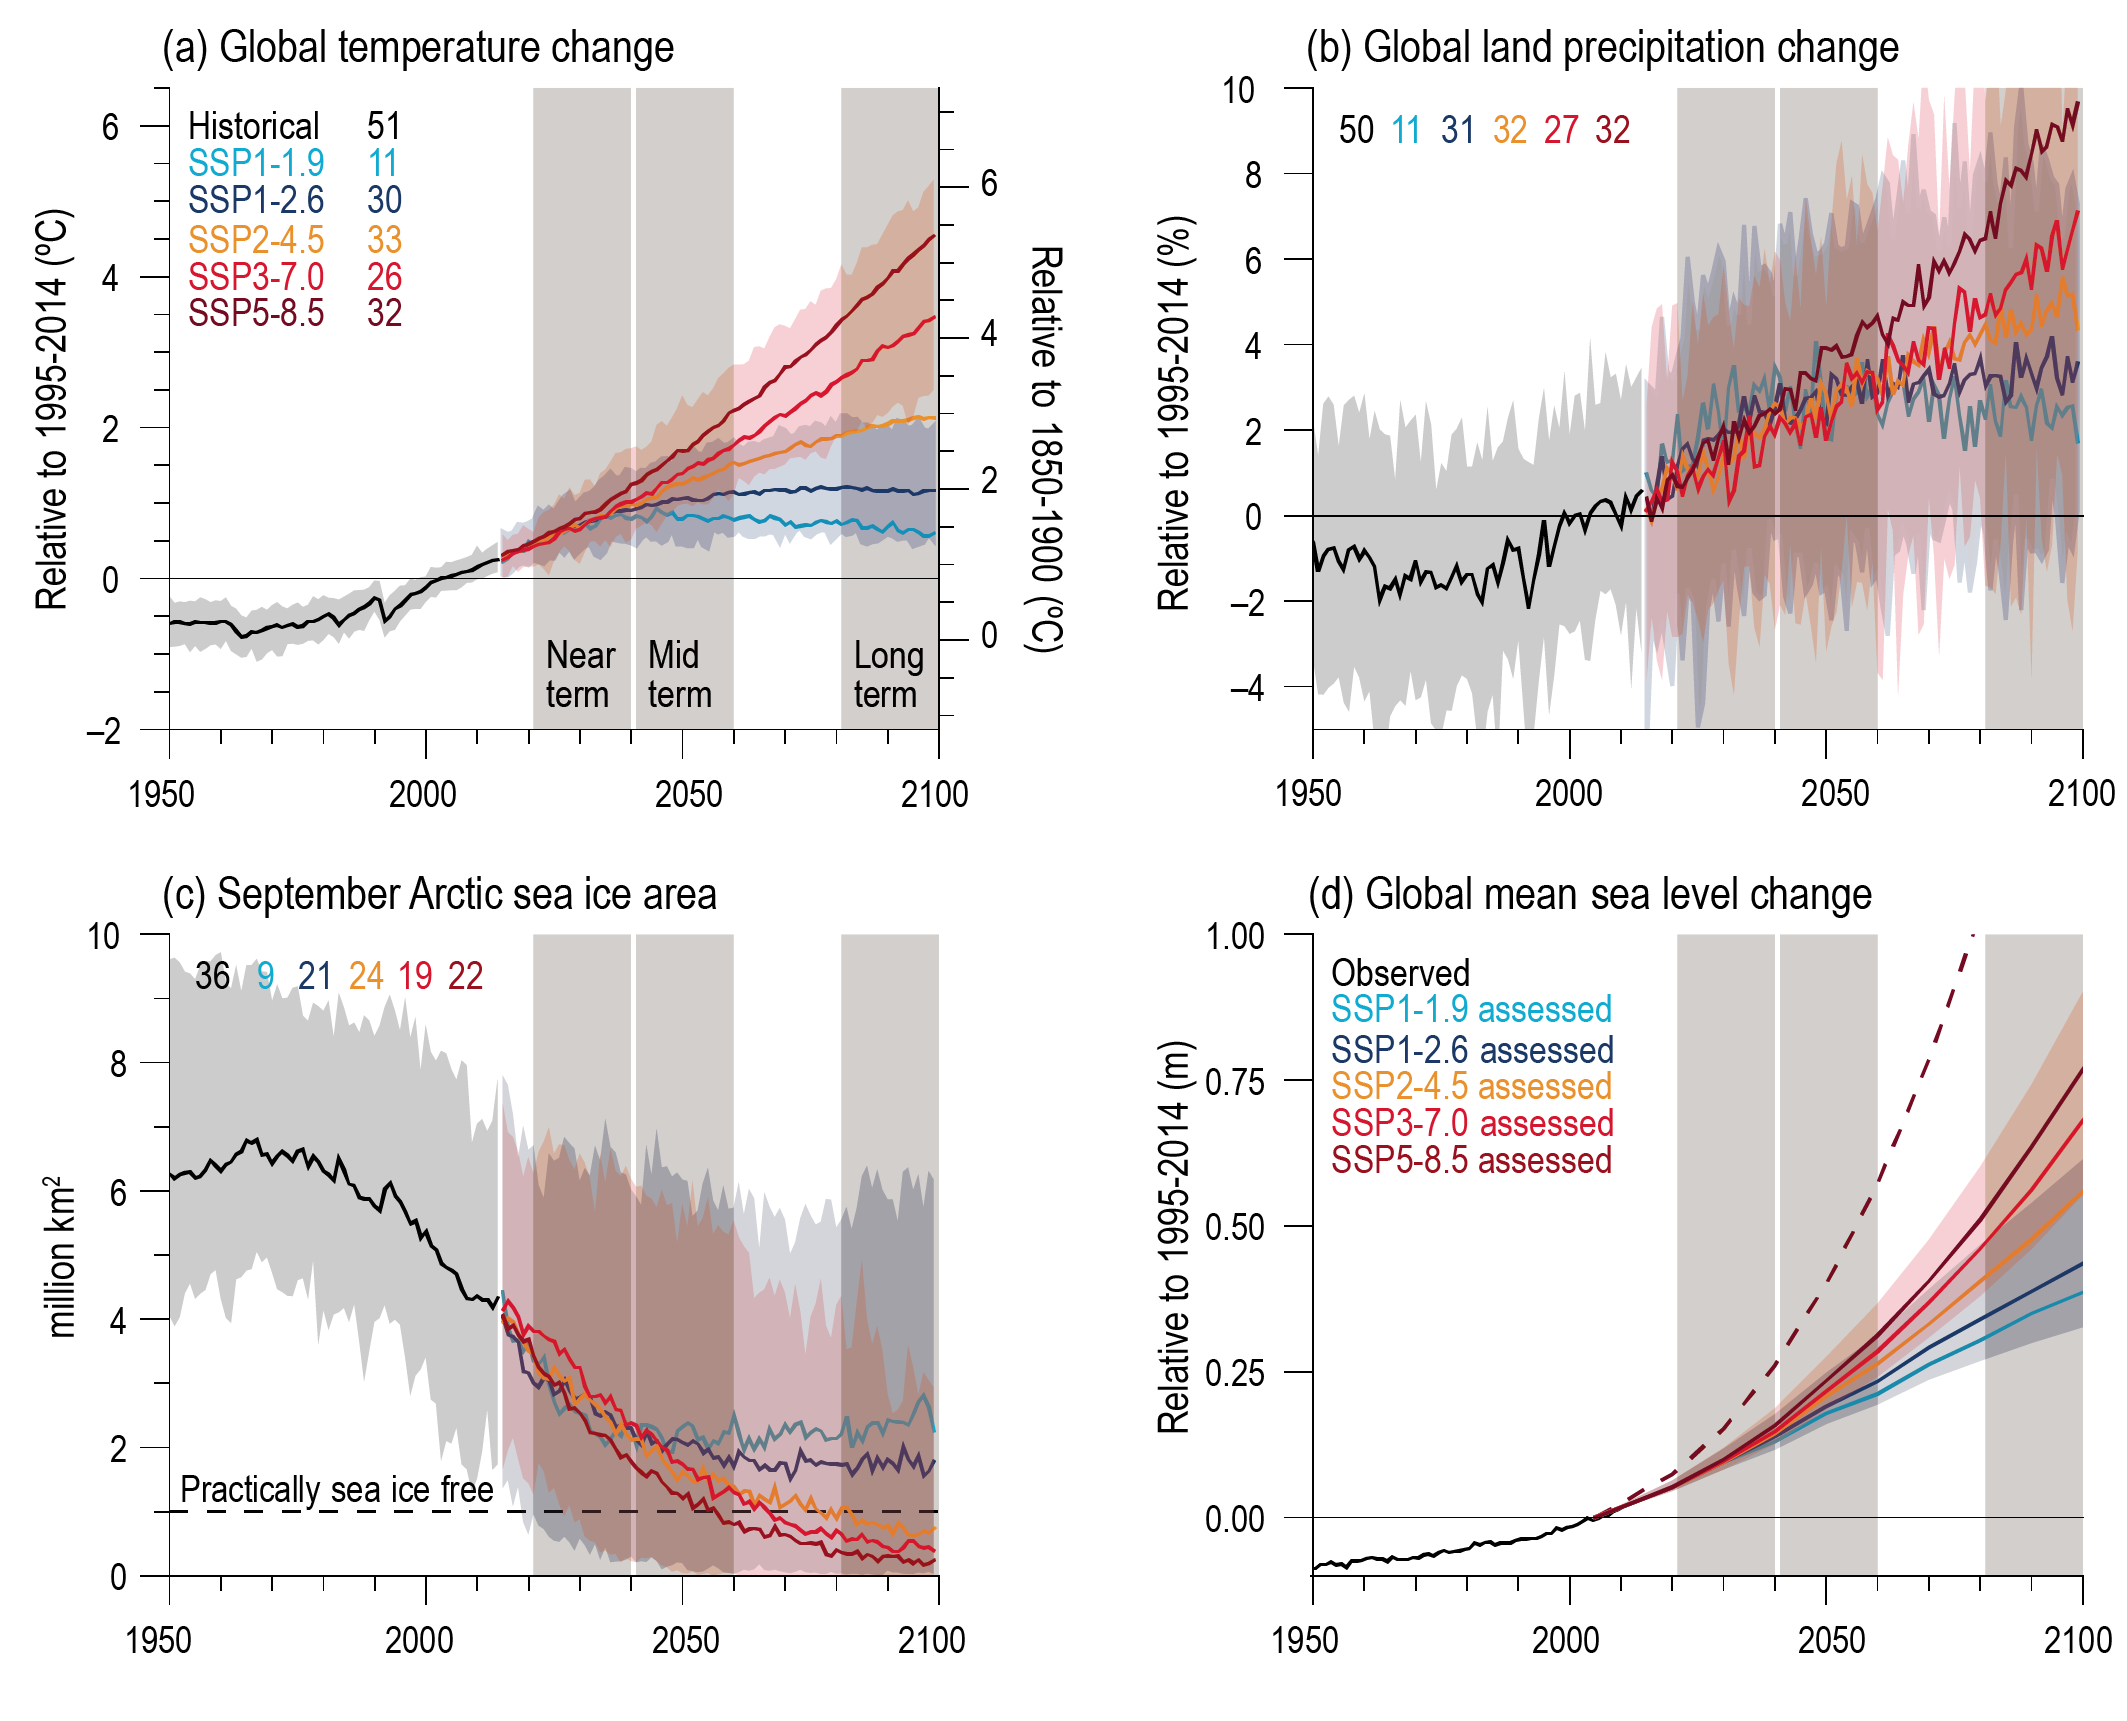
Figure caption
Figure 4.2 | Selected indicators of global climatechange from CMIP6 historical and scenario simulations. (a) Global surface air temperature changes relative to the 1995–2014 average (left axis) and relative to the 1850–1900 average (right axis; offset by 0.82°C, which is the multi-model mean and close to observed best estimate, Cross-Chapter Box 2.1, Table 1). (b) Global land precipitation changes relative to the 1995–2014 average. (c) September Arctic sea ice area. (d) Global mean sea level (GMSL) change relative to the 1995–2014 average. (a), (b) and (d) are annual averages, (c) are September averages. In (a–c), the curves show averages over the CMIP6 simulations, the shadings around the SSP1-2.6 and SSP3-7.0 curves show 5–95% ranges, and the numbers near the top show the number of model simulations used. Results are derived from concentration-driven simulations. In (d), the barystatic contribution to GMSL (i.e., the contribution from land-ice melt) has been added offline to the CMIP6 simulated contributions from thermal expansion (thermosteric). The shadings around the SSP1-2.6 and SSP3-7.0 curves show 5–95% ranges. The dashed curve is the low confidence and low likelihood outcome at the high end of SSP5-8.5 and reflects deep uncertainties arising from potential ice-sheet and ice-cliff instabilities. This curve at year 2100 indicates 1.7 m of GMSL rise relative to 1995–2014. More information on the calculation of GMSL is available in Chapter 9, and further regional details are provided in the Atlas. Further details on data sources and processing are available in the chapter data table (Table 4.SM.1).