Back chapter figures
Figure 4.20
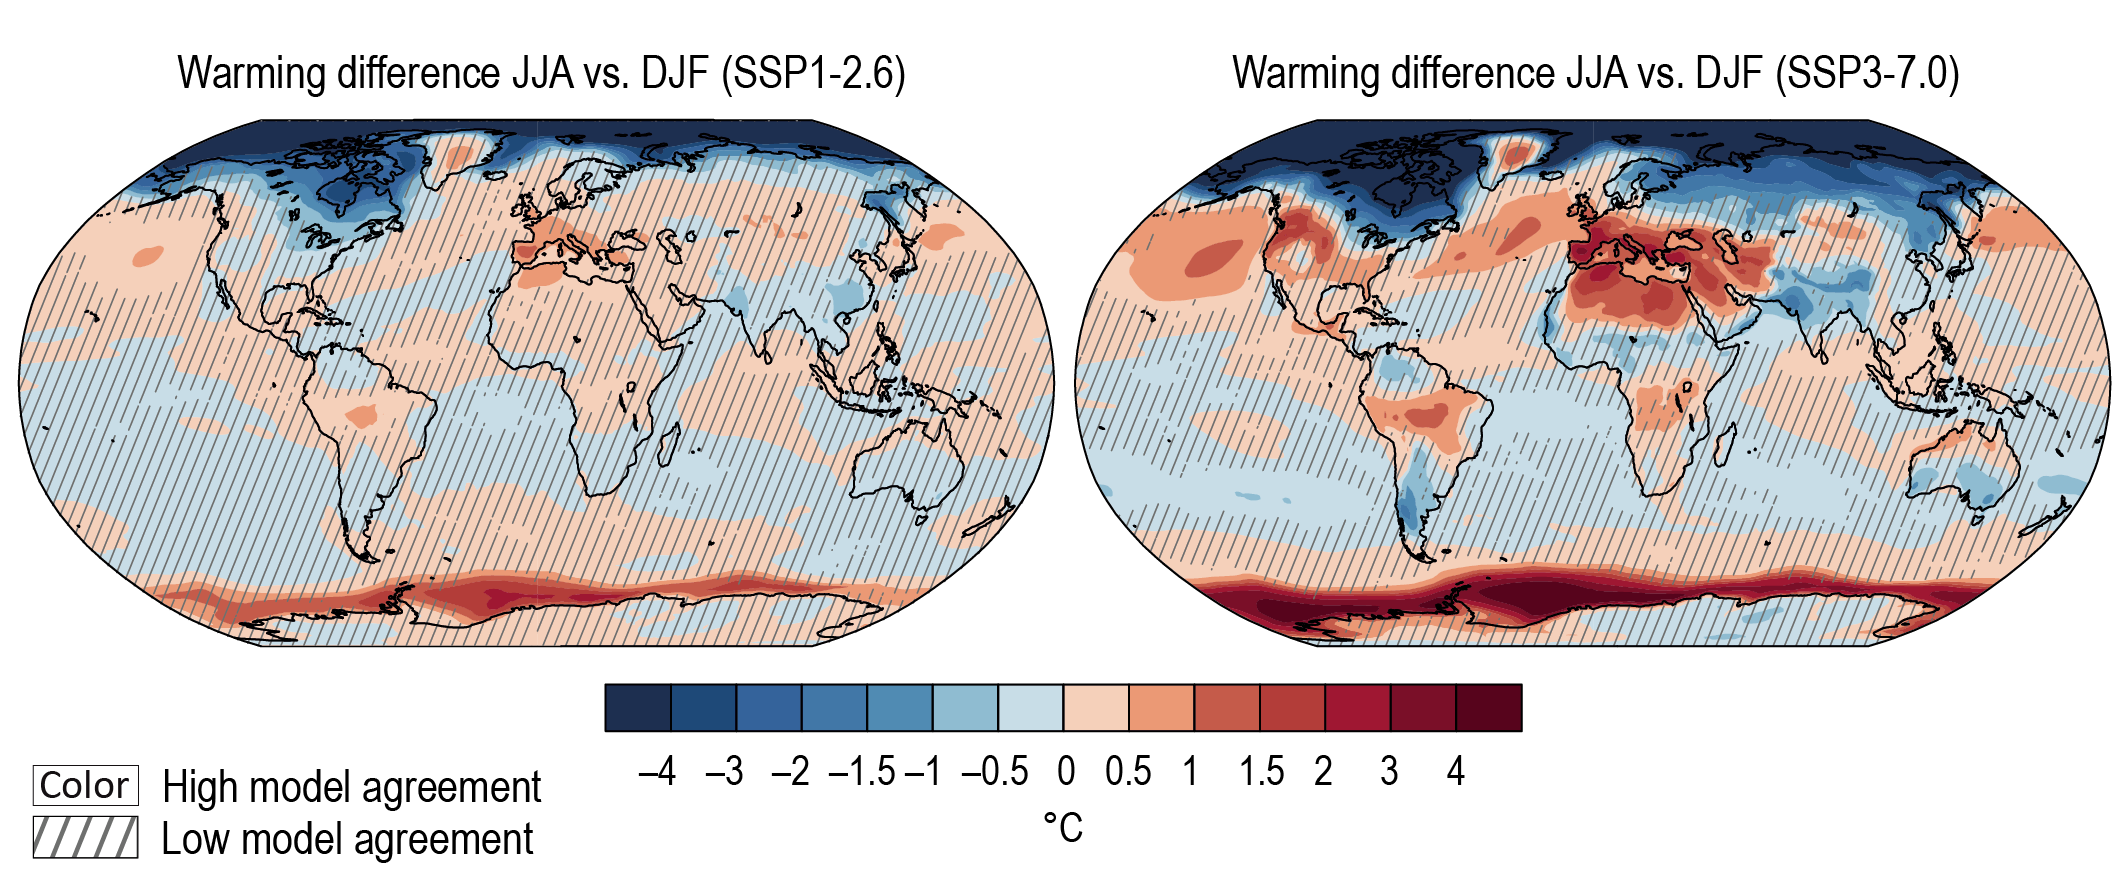
Figure caption
Figure 4.20 | Difference of surface temperature change between June–July–August (JJA) and December–January–February (DJF). Displayed are spatial patterns of multi-model mean difference in projected warming in JJA minus warming in DJF in 2081–2100 relative to 1995–2014 for (left) SSP1-2.6 and (right) SSP3-7.0. Diagonal lines mark areas where fewer than 80% of the models agree on the sign of change, and no overlay where at least 80% of the models agree. Further details on data sources and processing are available in the chapter data table (Table 4.SM.1).