Back chapter figures
Figure 4.21
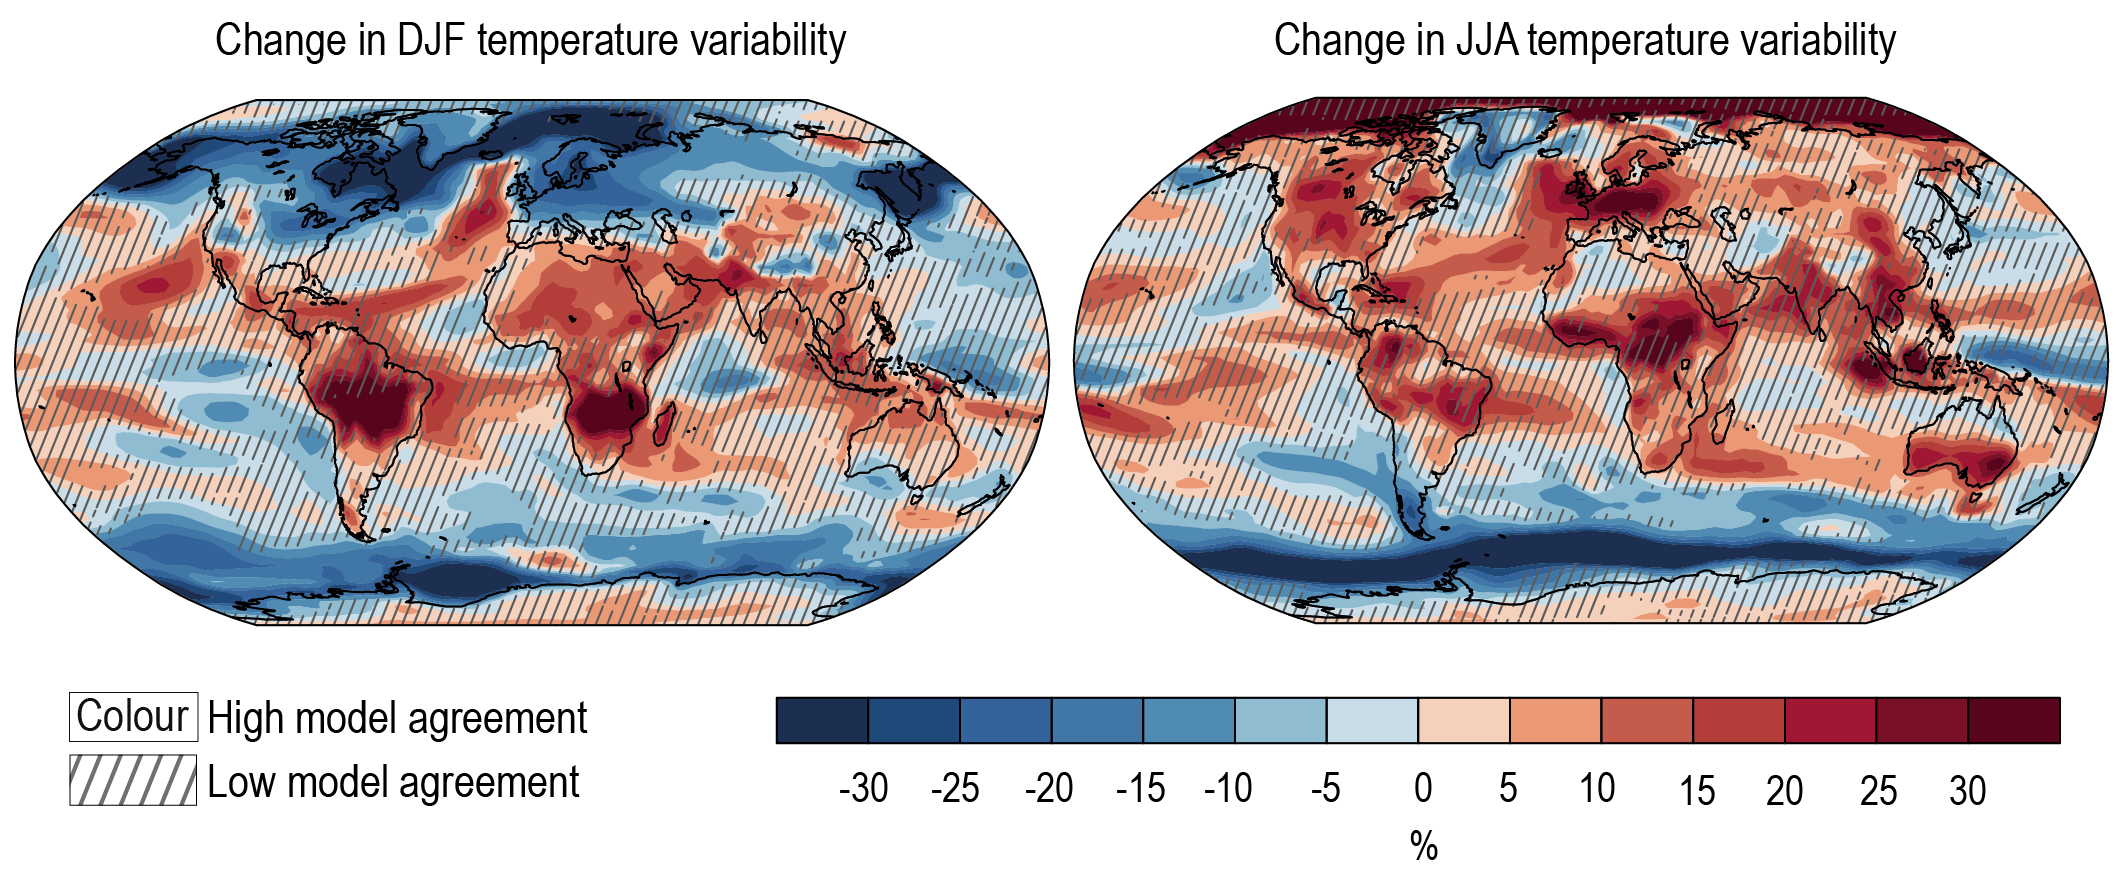
Figure caption
Figure 4.21 | Percentage change in interannual variability of (left) December–January–February (DJF) and (right) June–July–August (JJA) mean temperature averaged across seven large initial condition ensembles. Average changes across seven single-model, initial-condition large ensembles are shown for RCP8.5 in 2081–2100 (and where not available for 2080–2099) relative to 1995–2014. Standard deviations are calculated across all members of the large ensembles for every given year to avoid inflation due to the underlying trend and then averaged across the period. Changes are averaged across the ensembles MPI-GE (100 members, Maher et al., 2019), CanESM2 (50 members, Kirchmeier-Young et al., 2017), NCAR-CESM (30 members, Kay et al., 2015), GFDL-CM3 (20 members, Sun et al., 2018), GFDL-ESM2M (30 members, Rodgers et al., 2015), CSIRO-Mk3-6-0 (30 members, Jeffrey et al., 2013) and EC-EARTH (16 members, Hazeleger et al., 2010). Also see Deser et al. (2020) for further information on those ensembles. Diagonal lines indicate areas with low model agreement where fewer than 80% of the models agree on the sign of the change, and no overlay areas with high model agreement where at least 80% of the models agree on the sign of the change. Further details on data sources and processing are available in the chapter data table (Table 4.SM.1).