Back chapter figures
Figure 4.27
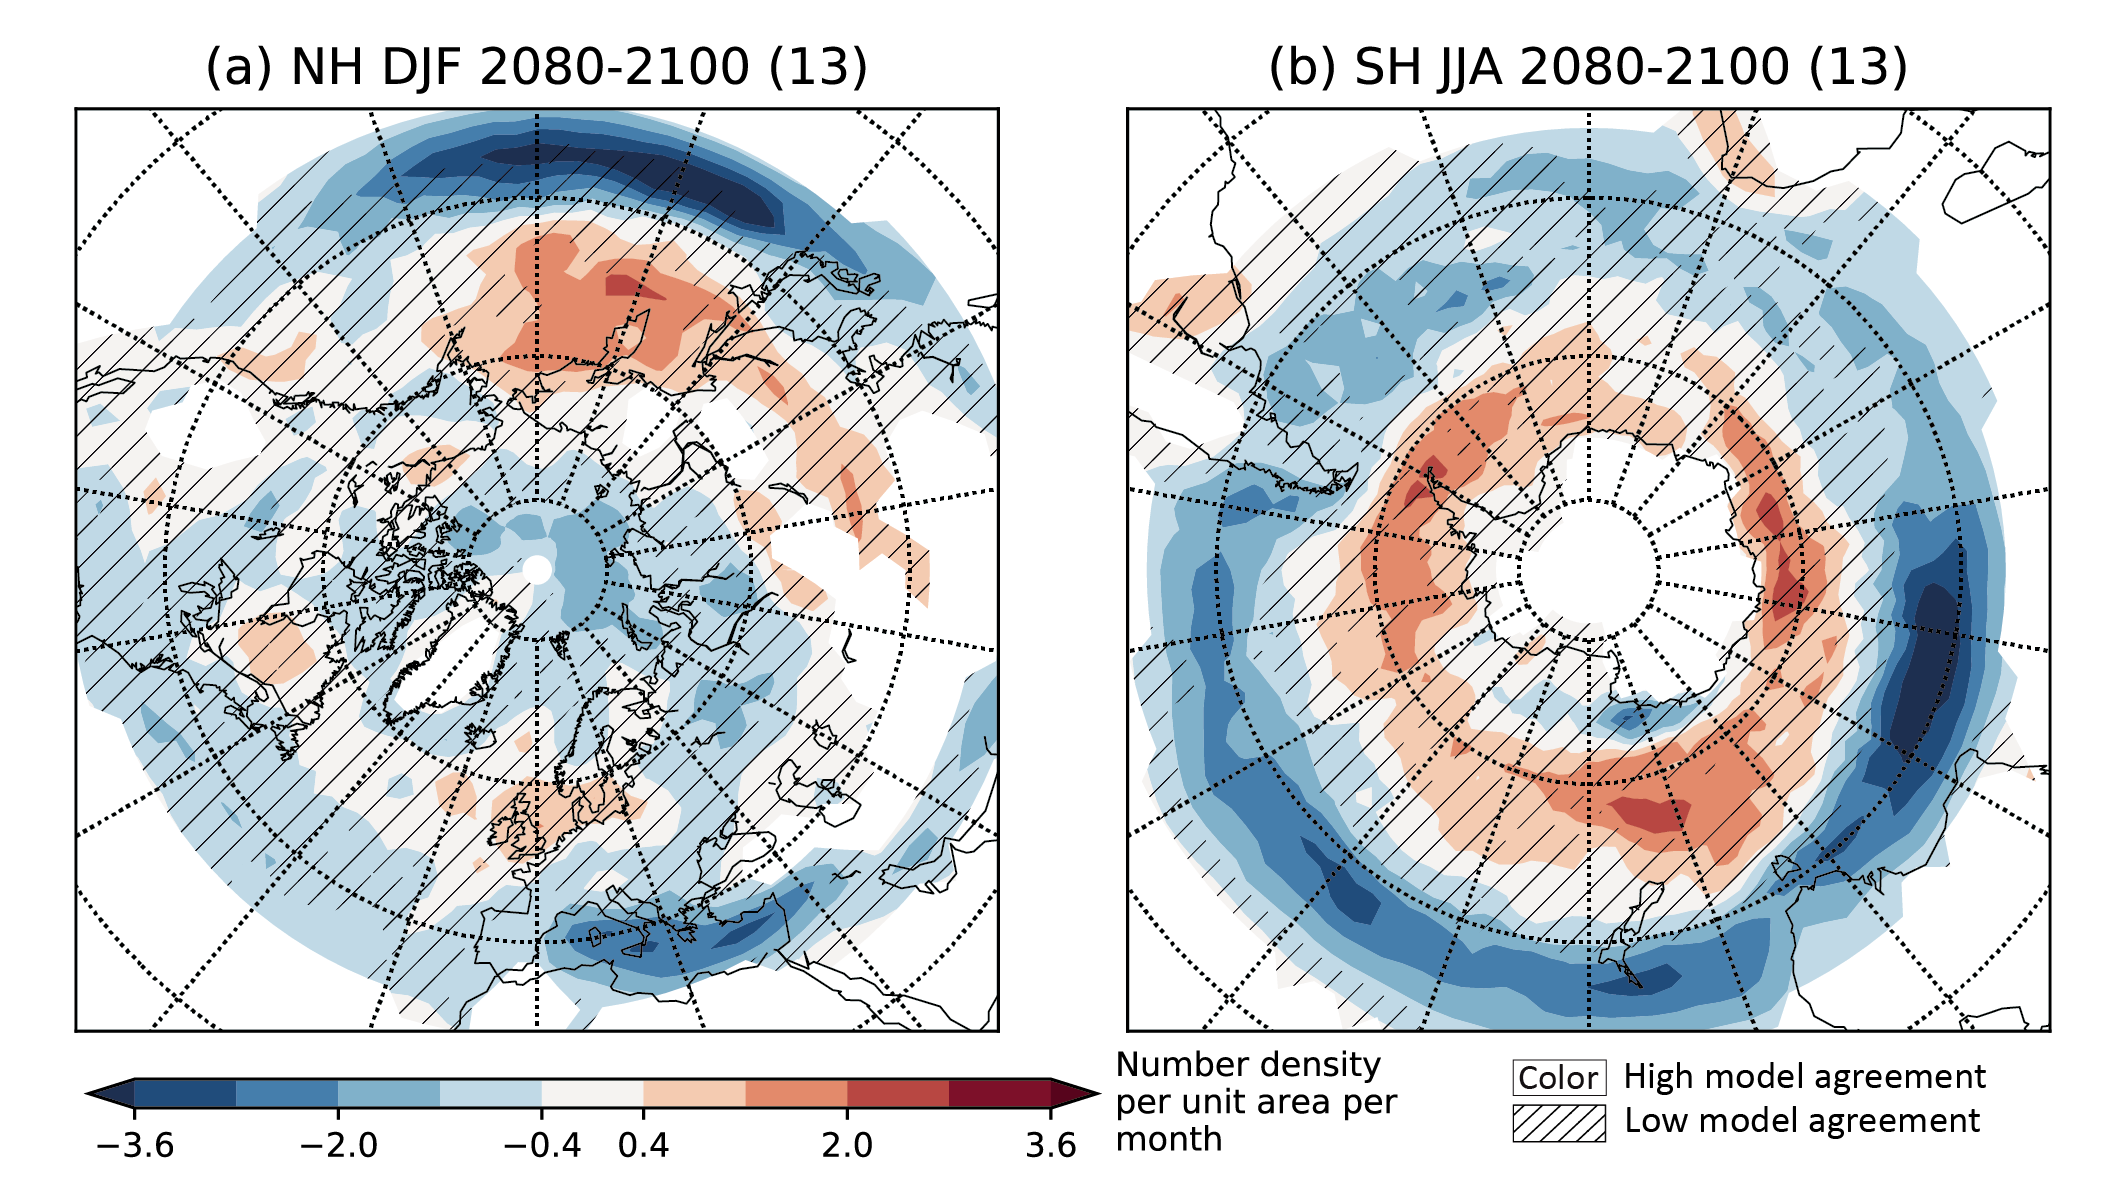
Figure caption
Figure 4.27 | Changes in extratropical storm track density. Displayed are projected spatial pattern of multi-model mean change of extratropical storm track density in winter (Northern Hemisphere December –January–Februrary, NH DJF, and Southern Hemisphere June–July–August, SH JJA) in 2080–2100 for SSP5-8.5 relative to 1979–2014 based on 13 CMIP6 models. Diagonal lines indicate regions where fewer than 80% of the models agree on the sign of the change and no overlay where at least 80% of the models agree on the sign of change. Units are number density per 5° spherical cap per month. Further details on data sources and processing are available in the chapter data table (Table 4.SM.1).