Back chapter figures
Figure 4.29
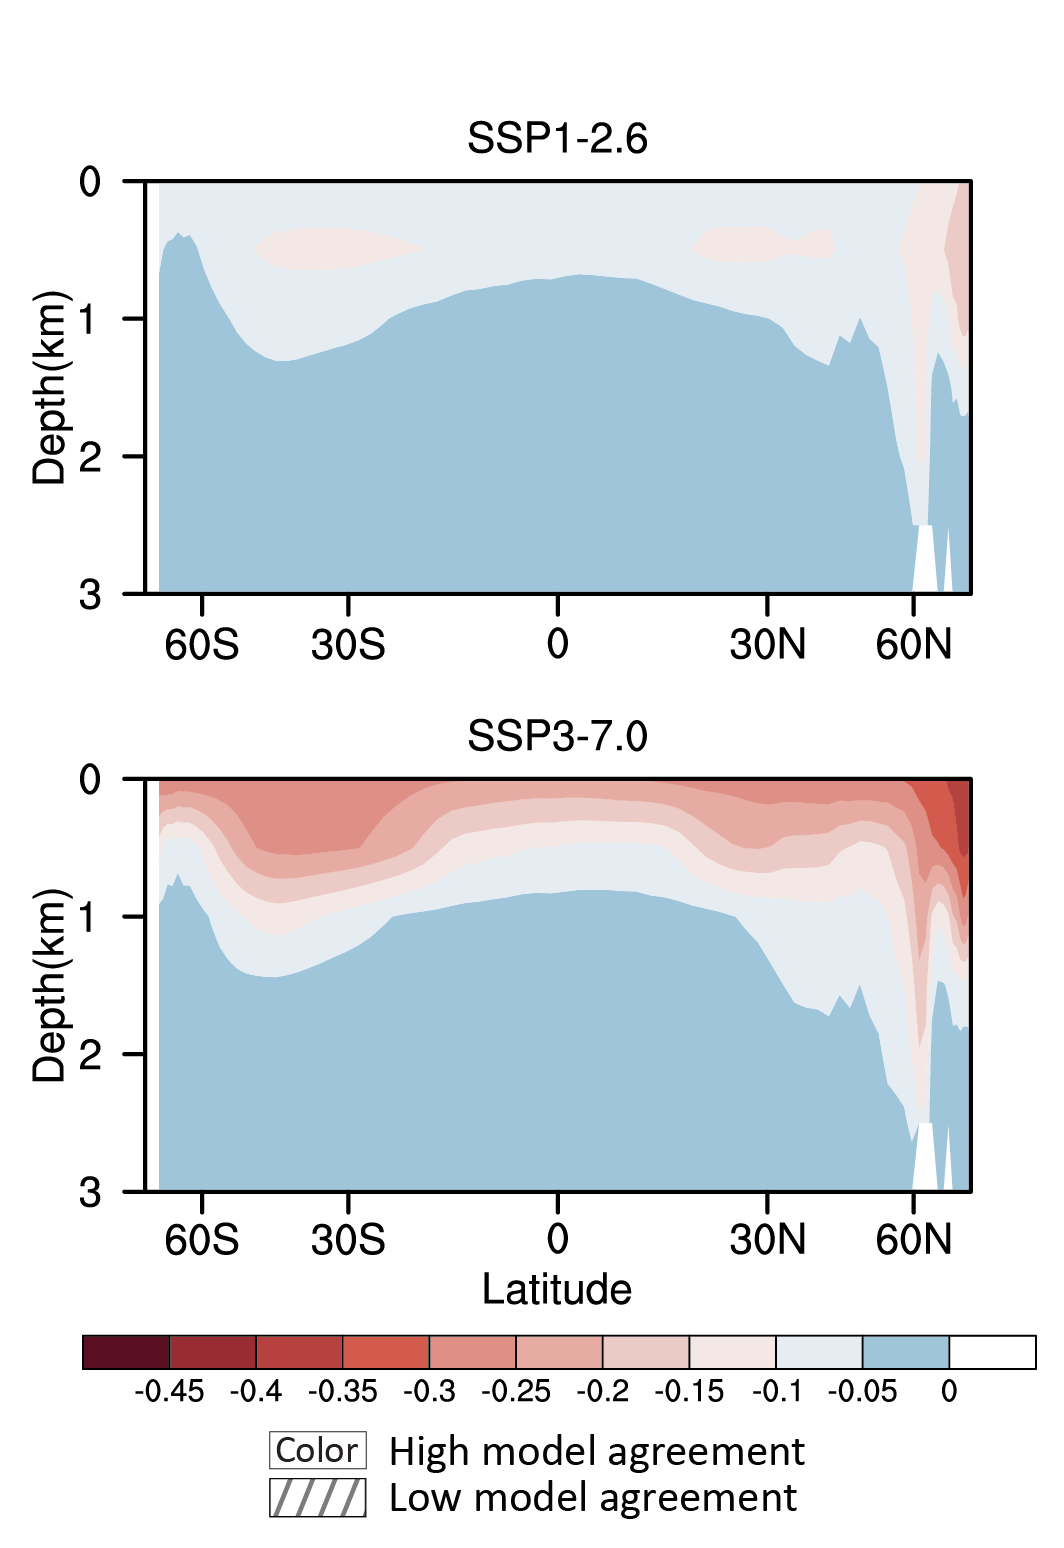
Figure caption
Figure 4.29 | Long-term change of annual and zonal ocean pH. Displayed are multi-model mean change in annual and zonal ocean pH in 2081–2100 relative to themean of 1995–2014 for SSP1-2.6 and SSP3-7.0, respectively. Eleven CMIP6 model results are used. Diagonal lines indicate regions where fewer than 80% of the models agree on the sign of the change and no overlay where at least 80% of the models agree on the sign of change. Further details on data sources and processing are available in the chapter data table (Table 4.SM.1).