Back chapter figures
Figure 4.3
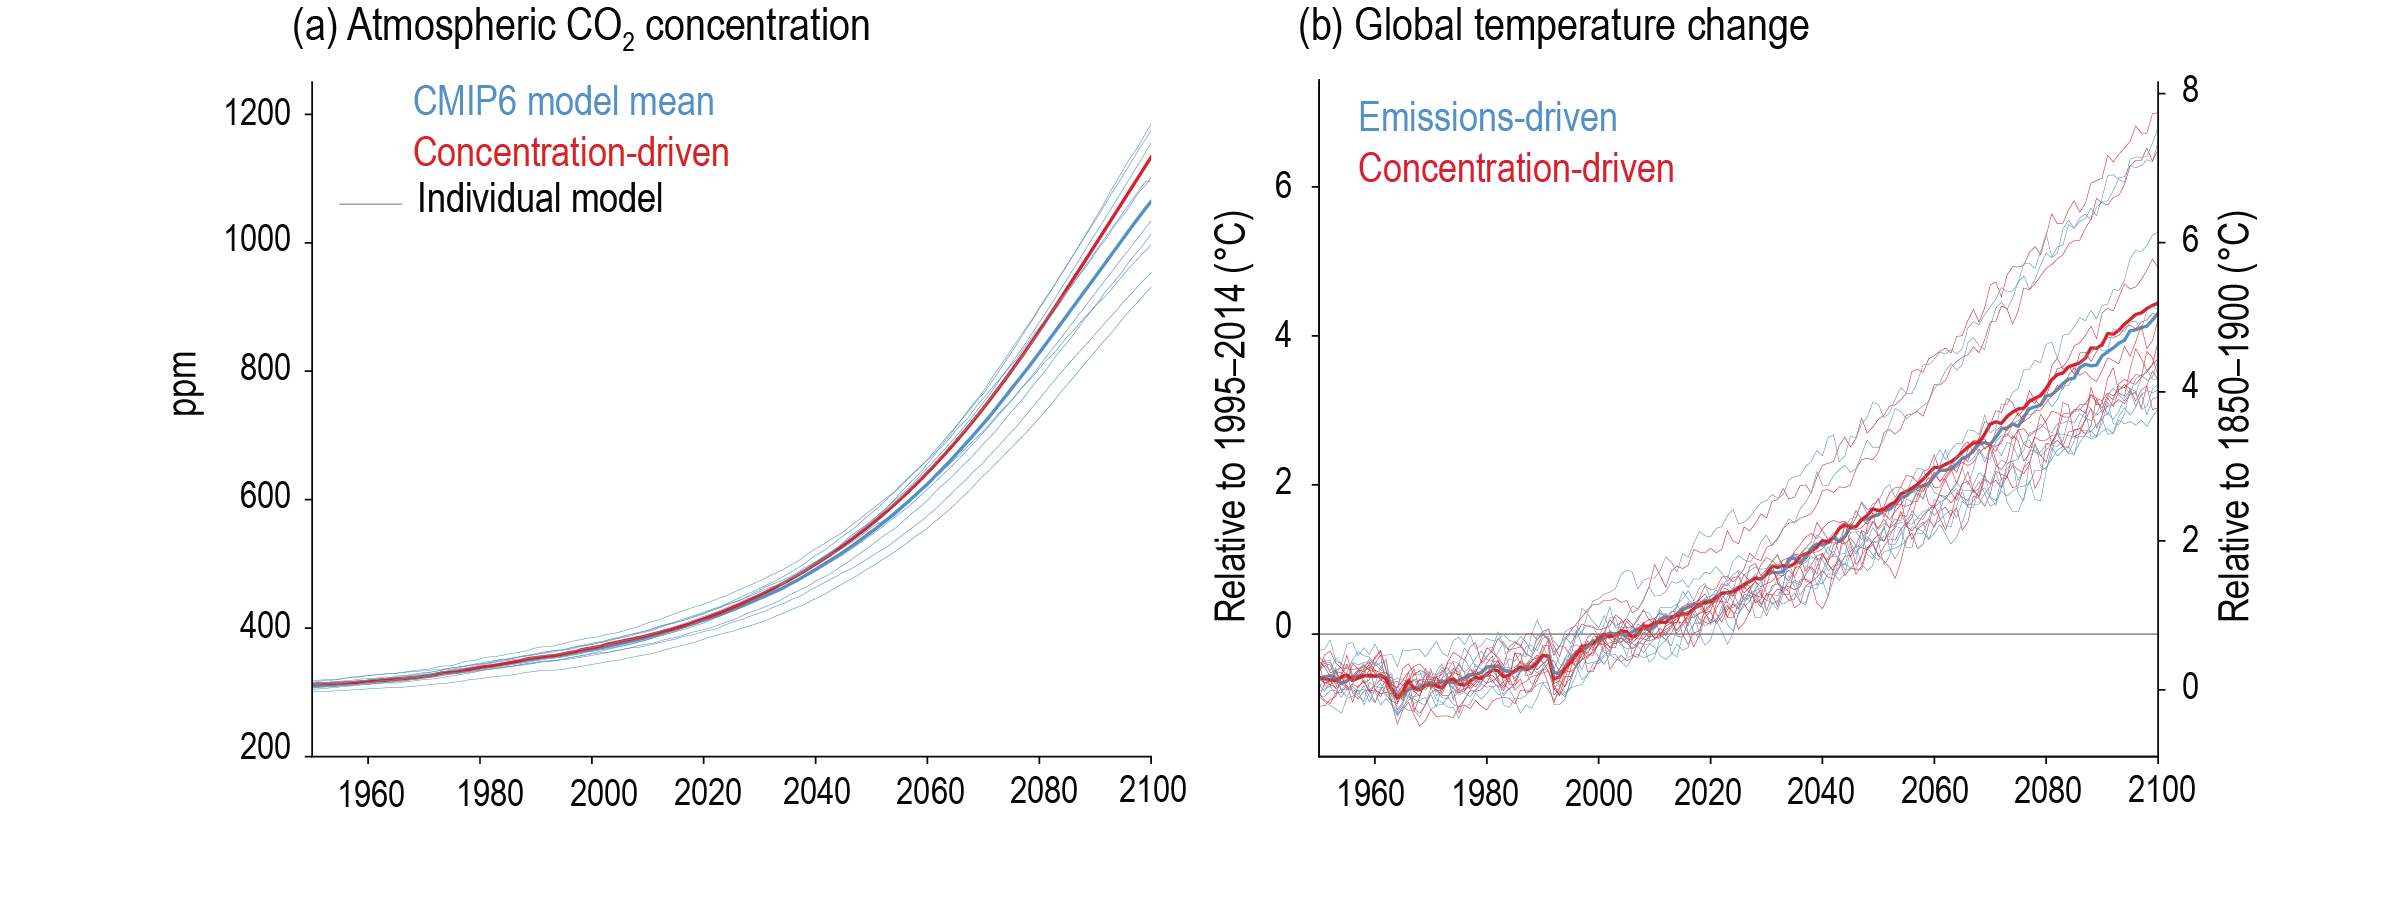
Figure caption
Figure 4.3 | Comparison ofconcentration-driven and emissions-driven simulation. (a) Atmospheric CO2 concentration; (b) global surface air temperature from models which performed SSP5-8.5 scenario simulations in both emissions-driven (blue) and concentration-driven (red) configurations. For concentration driven simulations, CO2 concentration is prescribed, and follows the red line in panel (a) in all models. For emissions-driven simulations, CO2 concentration is simulated and can therefore differ for each model, blue lines in panel (a). Further details on data sources and processing are available in the chapter data table (Table 4.SM.1).