Back chapter figures
Figure 4.32
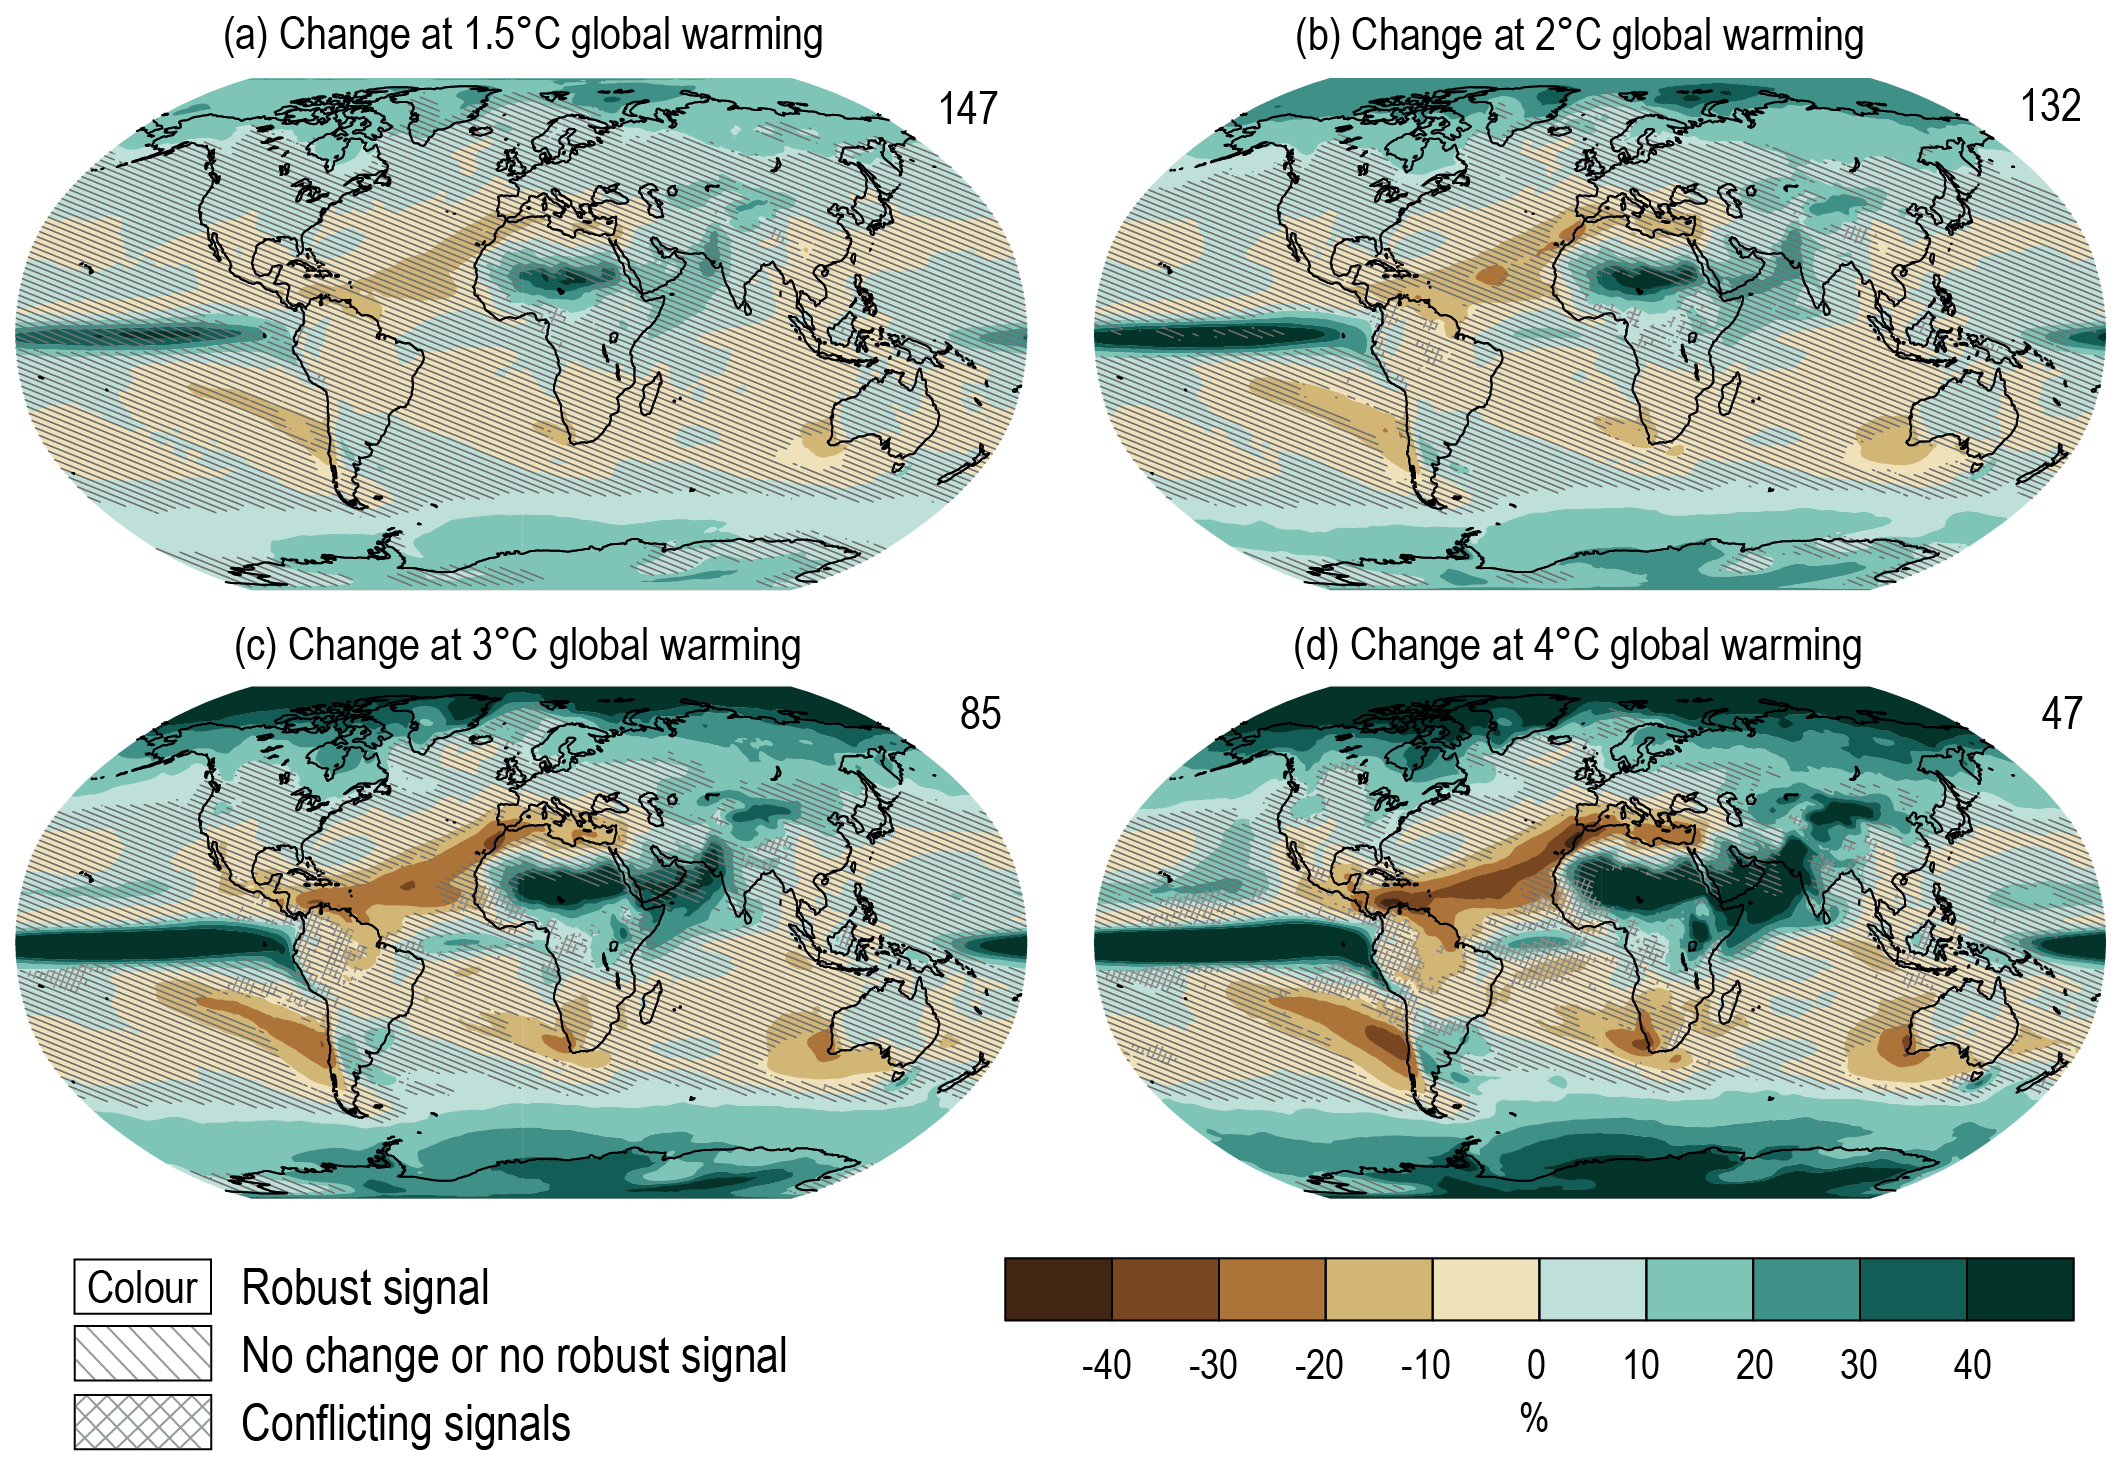
Figure caption
Figure 4.32 | Projected spatial patterns of change in annual average precipitation (expressed as a percentage change) at different levels of global warming. Displayed are (a–d) spatialpatterns of change in annual precipitation at 1.5°C, 2°C, 3°C, and 4°C of global warming relative to the period 1850–1900. No map overlay indicates regions where the change is robust and likely emerges from internal variability, that is, where at least 66% of the models show a change greater than the internal-variability threshold Section 4.2.6) and at least 80% of the models agree on the sign of change. Diagonal lines indicate regions with no change or no robust significant change, where fewer than 66% of the models show change greater than the internal-variability threshold. Crossed lines indicate areas of conflicting signals where at least 66% of the models show change greater than the internal-variability threshold but fewer than 80% of all models agree on the sign of change. Values were assessed from a 20-year period at a given warming level, based on model simulations under the Tier-1 SSPs of CMIP6. Further details on data sources and processing are available in the chapter data table (Table 4.SM.1).