Back chapter figures
Figure 4.33
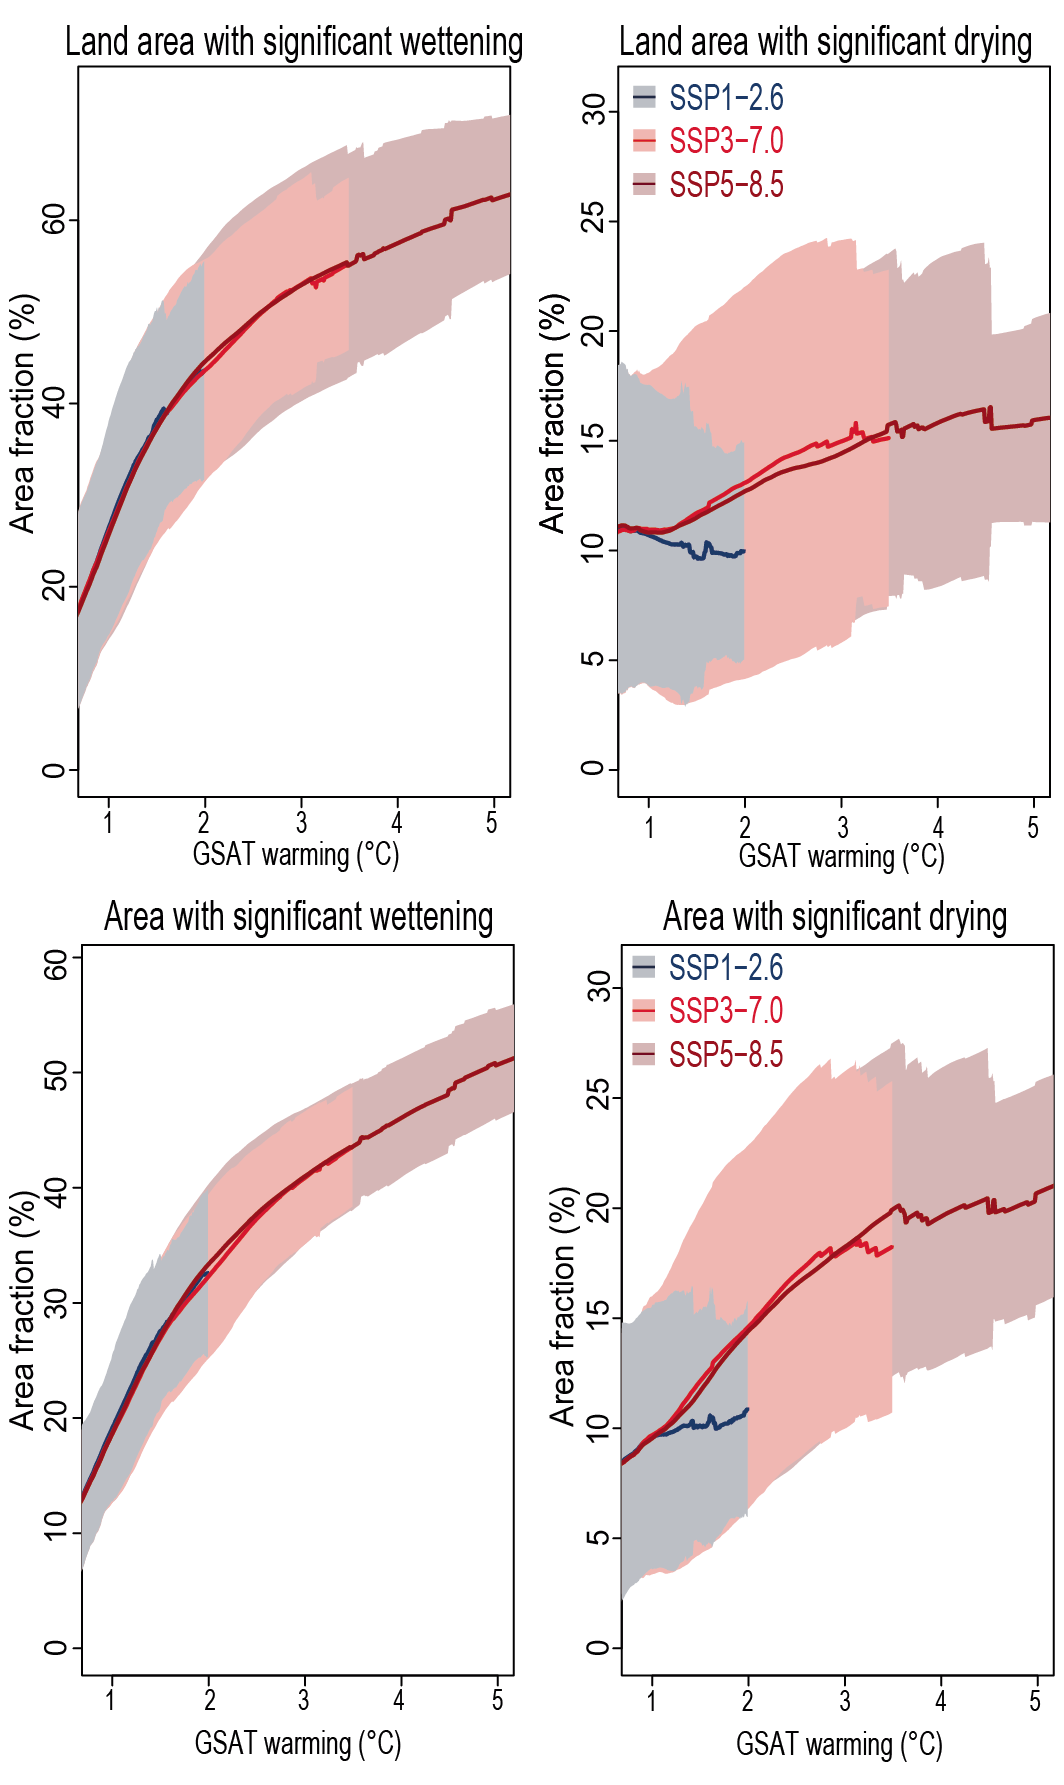
Figure caption
Figure 4.33 | Area fraction of significant precipitation change at 1.5°C, 2°C, 3°C, and 4°C of global warming. Range of land fraction (top) and global area fraction (bottom) with significant precipitation increase (left-hand side) and decrease (right-hand side) in the projected annual precipitation change (%) at levels of global warming compared to the period 1850–1900. Values were assessed from a 20-year period at a given warming level from SSP1-2.6, SSP3-7.0 and SSP5-8.5 in CMIP6. The solid line illustrates the CMIP6-multi model mean and the shaded band is the 5–95% range across models that reach a given level of warming. Further details on data sources and processing are available in the chapter data table (Table 4.SM.1).